
Comprehensive interpretation of hyperglycemia and hyperosmolality on the clinical outcomes among ischemic stroke patients
a b s t r a c t
Background: Hyperglycemia and hyperosmolality are associated with poor outcomes among acute ischemic stroke patients.
Objectives: We evaluated the association between hyperglycemia and hyperosmolality, as a combination mea- sure, with poor outcome among AIS patients.
Methods: We conducted a retrospective study of AIS patients admitted to the study hospital emergency depart- ment between January and December 2014. Hyperglycemia was defined as Serum glucose N144 mg/dL, and hyperosmolality was defined as a serum osmolality N295 mOsm/kg. After excluding hypoglycemia and hypoosmolality, the enrolled patients were classified into the following 4 subgroups: normoglycemia- normoosmolality, hyperglycemia-normoosmolality (HGNO), normoglycemia-hyperosmolality (NGHO), and hyperglycemia-normoosmolality (HGHO). The primary outcome was poor neurological status at 6 months, which was defined as a modified Rankin Scale score >=2.
Results: Six hundred seven patients were included. The primary outcome was 336 (55.4%), and it was highest in the HGNO group (69.6%, 103/148), followed by the HGHO group (67.9%, 53/78), the NGHO group (57.3%, 43/75) and the normoglycemia-normoosmolality group (44.7%, 137/306). The multivariable logistic regression analysis revealed that HGNO and HGHO remained significant factors, with primary outcomes (adjusted odds ratio, 2.08; 95% confidence interval, 1.16-3.71) and 2.93 (1.45-5.91), respectively), whereas NGHO was not a significant fac- tor. Cases of extremely high Sodium levels were few in the NGHO and HGHO groups, whereas considerable cases of extremely high glucose level were observed in the HGHO group.
Conclusion: Hyperglycemia was associated with poor outcome, even after excluding the effect of hyperosmolality. However, hyperosmolality without hyperglycemia was not associated with poor outcome. An additive effect, likely reflecting severe hyperglycemia, was observed.
(C) 2016
Introduction
Although the incidence and mortality of stroke is decreasing [1], stroke remains the leading cause of death and disability [2]. Researchers identified predictors for outcome after stroke attack, associated with glucose control, inflammation, hemostasis, neuronal or glial injury, and even cardiac dysfunction [3].
? Declaration of interest: The authors report no conflicts of interest. The authors are re- sponsible for the content and drafting of this manuscript.
* Corresponding author at: Department of Emergency Medicine, Research Institute of Clinical Medicine of Chonbuk National University and Biomedical Research Institute of Chonbuk National University Hospital, 567 Baekje-daero, Deokjin-gu, Jeonju-si, Jeollabuk-do 54907, Republic of Korea. Fax: +82 63 250 1075.
E-mail address: [email protected] (S. Jo).
Hyperglycemia occurs frequently, up to 60% among acute ischemic stroke patients [4,5], and it is a poor prognostic factor in stroke pa- tients, in addition to mortality, longer In-hospital stays, and increased costs [6,7,8,9]. Several mechanisms have been proposed, including in- creased tissue acidosis from anaerobic metabolism, free radical genera- tion, and increased blood brain barrier permeability [10]. The American Heart Association/American Stroke Association recommended a serum glucose target range from 140 to 180 mg/dL (7.8-10 mmol/L) [11], and the European Stroke Initiative guideline recommends a Glycemic control for serum glucose N180 mg/dL (N10 mmol/L) [12].
The serum glucose level is one of the determining factors of serum os- molality, as well as sodium and Blood urea nitrogen , and increased serum glucose levels lead to increased serum osmolality. The deleterious effect of increased serum osmolality on clinical outcome after acute stroke has previously been reported [13]. Thus, it is not clear whether hyperglycemia without hyperosmolality is associated with poor outcome
http://dx.doi.org/10.1016/j.ajem.2016.08.046
0735-6757/(C) 2016
in ischemic stroke patients. In addition, hyperosmolality without hyperglycemia is a major concern. Furthermore, hyperglycemia and hyperosmolality could synergistically affect outcome. However, to date, we are unaware of any studies investigating this issue.
The present study attempted to comprehensively interpret the effects of hyperglycemia and hyperosmolality on clinical outcome among AIS pa- tients. Primarily, we attempted to determine the association between poor outcome and hyperglycemia without hyperosmolality and hyperosmolality without hyperglycemia, controlling for potential con- founders. We also investigated the potential synergistic effect on the poor outcome among patients showing hyperglycemia with hyperosmolality.
Methods
Study design and subjects
We performed a retrospective chart review study. This study was approved through the institutional review board (IRB) of the study hos- pital, and the institutional review board waived the requirement of in- formed consent for all subjects in the present study. The study hospital is a 1200-bed urban academic, tertiary care, university hospital. Suspected neurological patients were initially evaluated by emergency department (ED) physicians and then by neurology attending physi- cians in the study hospital ED.
All consecutive adult patients admitted via the study hospital ED with an admission diagnosis of ischemic stroke (International Statistical classification of Diseases, 10th Revision, codes I630x, I631x, I632x, I633x, I634x, I635x, I636x, I638x, and I639x between January 1 and De- cember 31, 2014) were screened. Patients with the following conditions were excluded from the present study: (1) unable to determine the neurological status at 6 months; (2) unable to determine the initial serum glucose or serum osmolality level; (3) ethanol or methanol in- toxication; and (4) hypoglycemia defined as serum glucose b70 mg/dL and hypoosmolality status defined as serum osmolality b275 mOsm/kg at ED arrival.
All patients were admitted to an acute stroke unit and treated ac- cording to the current international guidelines [14]. Complete medical histories, physical and Neurological examinations, laboratory tests, elec- trocardiograms, and radiological tests, including brain magnetic reso- nance images, were performed on admission. The stroke subtype was classified using the Trial of Org 10172 in the Acute Stroke Treatment (TOAST) criteria, including atherothrombotic, cardioembolic, lacunar, and other determined and undetermined etiologies [15]. An attending neurologist also assessed the Stroke severity using the National Institute of Health Stroke Scale at the time of admission [16].
Outcome measures
The dead and functional status was evaluated at discharge and at 6 months using the modified Rankin Scale (mRS) [17]. The poor outcome was determined as an mRS score of 2 or higher (mRS >=2, mRS 2-6). [18,19,20]. A poor outcome at 6 months was the primary concern of the present study. Death at discharge and 6 months, and poor outcome at discharge were concerns of the secondary analysis.
CT characteristics“>Data collection and processing
Demographics, clinical data, physical and neurological findings, and initial laboratory findings, including serum glucose, sodium, and BUN levels, were collected by a trained abstractor using standardized data col- lection techniques according to the guidelines of Gilbert et al [21]. Serum osmolality was not a routine test in the study hospital ED; thus, we calcu- lated serum osmolality using the following traditional formula: serum os- molality = (2x (Na [mmol/L]) + (BUN [mg/dL] / 2.8) + (glucose [mg/dL]
/ 18) [22,23]. Hyperosmolality was defined as serum osmolality above 295 mOsm/kg (N295 mOsm/kg). Hyperglycemia was determined as
random serum glucose above 144 mg/dL or 8 mmol/L (N144 mg/dL) [7,24]. The enrolled patients were classified into 4 subgroups according to existence of hyperglycemia and hyperosmolality. Group 1, normoglycemia and normoosmolality (NGNO), serum glucose <=144 mg/dL and serum os- molality <=295 mOsm/kg; group 2, hyperglycemia and normoosmolality (HGNO), serum glucose N144 mg/dL and serum osmolality <=295 mOsm/kg; group 3, normoglycemia and hyperosmolality (NGHO), serum glucose
<=144 mg/dL and serum osmolality N295 mOsm/kg; and group 4, hyper- glycemia and hyperosmolality (HGHO), serum glucose N144 mg/dL and serum osmolality N295 mOsm/kg. The level of glucose was allowed in both way--serum blood by venipuncture or peripheral blood by pin- prick in the present study.
Statistical analysis
Descriptive statistics were presented for all enrolled patients and subgroups–NGNO, HGNO, NGHO, and HGHO. Continuous data are pre- sented as the means and SD or median and interquartile range. Normally distributed data were compared using analysis of variance with Scheffe post hoc analysis, and nonnormally distributed data were compared using the Kruskal-Wallis test. Categorical data are presented as the count and percentage and compared using the ?2 test or Fisher exact test as appropriate. Statistical significance was defined as a 2-sided P b .05. We used locally weighted scatterplot smoothing (LOWESS) to graphically demonstrate the relationship between the primary outcome and the serum glucose and serum osmolality levels, respectively. The LOWESS is a type of nonparametric regression used to summarize the association between 2 variables utilizing relatively few assumptions re-
garding the strength or form of the relationship [25].
To investigate the association between each subgroup and outcome, we performed a logistic regression analysis. We tested the following variables: age category, sex, history of hypertension, history of diabetes mellitus , history of dyslipidemia, history of congestive heart fail- ure, history of coronary artery disease, history of atrial fibrillation, histo- ry of previous stroke, chronic kidney disease, current smoker, ex- smoker, physiologies, time interval from onset of stroke symptoms to ED arrival, baseline NIHSS score, stroke subtype measured according to the TOAST, intravenous thrombolysis (IVT), interval from door to IVT, transfemoral cerebral angiography (TFCA), interval time from door to TFCA, symptomatic intracranial hemorrhage (ICH), serious/ Life-threatening hemorrhage, creatinine (Cr), BUN/Cr ratio, hemoglobin A1c (HbA1c), lactate, high sensitive C-reactive protein (hs-CRP), and ammonia level [26,27,28,29,30,31,32]. Collinearity between variables was assessed to ensure that no significant collinearity was present. Thereafter, a multivariable logistic regression model was constructed with an adjustment for potential confounding factors, which showed a trend (P b .1). The results of logistic regression analyses are presented as odds ratio with a 95% confidence interval (CI) and considered signif- icant when 2-tailed P b .05.
We referred to the Strengthening the Reporting of Observational Studies in Epidemiology recommendations for analysis of the results [33]. All analyses were conducted using STATA 11.1 (StataCorp LP, TX) and SAS 9.1 (SAS Institute Inc, Cary, NC).
Results
Study subject characteristics
During the study period, 895 patients were screened. After excluding 99 patients, (82 other medical or surgical conditions and 17 not AIS cases), 796 patients met the eligibility criteria. Among these patients, we excluded the following: (1) 178 patients who were unable to deter- mine the neurological status at 6 months; (2) 0 patients unable to deter- mine initial serum glucose or serum osmolality level; (3) 0 patients with ethanol or methanol intoxication; and (4) 0 patients with hypoglycemia
defined as serum glucose b70 mg/dL and 11 patients with hypoosmolality statuses defined as serum osmolality b275 mOsm/kg at ED arrival.
A total of 607 patients were enrolled in the present study (Fig. 1). Among the enrolled patients, 306 (50.4%) patients were assigned to the NGNO group, 148 (24.4%) patients were assigned to the HGNO group, 75 (12.4%) patients were assigned to the NGHO group, and 78 (12.9%) patients were assigned to the HGHO group.
The mean age of the entire cohort was 69.4 +- 12.0 years, and 376 (61.9%) patients were male. Other baseline characteristics of the entire cohort are shown in Table 1. The baseline characteristics and compari- sons among the 4 subgroups are also noted in Table 1. Between sub- groups, there were significant differences in presence of hypertension, DM, congestive heart failure, chronic disease, and NIHSS at presentation. Among the total enrolled cohort, the serum glucose ranged from 71 to 646 mg/dL, with a mean value and SD of 148.8 +- 66.3 mg/dL. Serum osmolality ranged from 275.0 to 324.8 mOsm/kg, with a mean value and SD of 291.2 +- 6.9 mOsm/kg. serum sodium ranged from 126 to 151 mmol/L, with a mean value and SD of 138.1 +- 3.0 mmol/L. Serum BUN ranged from 4 to 83 mg/dL, with a mean value and SD of 18.7 +-
8.1 mg/dL (Table 2). Among all patients in the study cohort, hyperglyce- mia was observed in 37.3% of the patients and hyperosmolality was shown in 25.3% of the patients.
Table 2 demonstrated the laboratory findings in detail among the 4 groups. The mean serum glucose; osmolality BUN; and Cr, HbA1c, and hs-CRP levels were highest in the HGHO group. The mean sodium level was highest in the NGHO group. Severe laboratory disarrangement was frequently observed in cases of hyperglycemia, but osmolality, so- dium, and BUN were not. Distribution of glucose, osmolality, sodium, and BUN between each subgroup is shown in Fig. 2. Notably, there was a significant difference in the serum glucose levels between the
HGNO and HGHO groups, but osmolality did not differ between the NGHO and HGHO groups. Serum sodium and BUN levels were signifi- cantly different between the HGNO and HGHO groups.
The LOWESS curve analysis is shown in Fig. 3. A near linear relation- ship was demonstrated between the serum glucose level and the cumu- lative frequency of poor outcome at 6 months at a glucose level of approximately 110 mg/dL. The serum osmolality level and cumulative frequency of poor outcome demonstrated a near linear relationship above an osmolality level of approximately 290 mOsm/kg. There were no significant points of serum glucose or osmolality showing a curve flattening, suggesting that there were practically no additional cases of poor outcomes.
Outcomes and logistic regression analysis
Table 3 shows the distribution of mRS at discharge and 6 months for each subgroup. The mRSs at 2 time points were significantly different between the subgroups.
Primary outcome of mRS >=2 at 6 months was 55.4% (336/607). The primary outcome of each subgroup is shown in Fig. 4. The primary out- come was highest in the HGNO group (69.6%, 103/148), followed by the HGHO group (67.9%, 53/78), NGHO group (57.3%, 43/75), and NGNO
group (44.7%, 137/306). Poor outcome was more frequent in the HGNO and HGNO groups than in the NGNO group (P b .001), but not the NGHO group (P = .051). There were no significant differences in the primary outcomes between the HGNO, NGHO, and HGHO groups. P = .069 when the NGHO group was compared with the HGNO group. The results of the logistic regression analysis are shown in Table 4. In the univariate analysis, HGNO and HGHO groups were associated with primary outcome (poor outcome at 6 months). In regard to secondary

Fig. 1. Strengthening the Reporting of Observational Studies in Epidemiology flow diagram for the study.
|
Baseline characteristics of the enrolled patients |
||||||||||
|
All |
NGNO |
HGNO |
NGHO |
HGHO |
P |
|||||
|
No. |
607 (100%) |
306 (50.4%) |
148 (24.4%) |
75 (12.4%) |
78 (12.9%) |
|||||
|
Age, y |
69.4 +- 12.0 |
68.3 +- 12.2 |
69.2 +- 12.5 |
71.8 +- 11.3 |
71.2 +- 10.8 |
.06 |
||||
|
b65 |
184 (30.3) |
102 (33.3) |
47 (31.8) |
16 (21.3) |
19 (24.4) |
.21 |
||||
|
65-74 |
189 (31.0) |
99 (32.4) |
39 (26.4) |
25 (33.3) |
26 (33.3) |
|||||
|
>=75 |
234 (38.6) |
105 (34.3) |
62 (41.9) |
34 (45.3) |
33 (42.3) |
|||||
|
Male sex, % |
376 (61.9) |
197 (64.4) |
85 (57.4) |
45 (60.0) |
49 (62.8) |
.53 |
||||
|
Comorbidity |
||||||||||
|
Hypertension, % |
349 (57.5) |
149 (48.7) |
96 (64.9) |
46 (61.3) |
58 (74.4) |
b.01 |
||||
|
DM, % |
175 (28.8) |
40 (13.1) |
76 (51.4) |
10 (13.3) |
49 (62.8) |
b.01 |
||||
|
Dyslipidemia, % |
63 (10.5) |
32 (10.5) |
15 (10.1) |
8 (10.7) |
8 (10.3) |
1.00 |
||||
|
Congestive heart failure, % |
16 (2.6) |
4 (1.3) |
9 (6.1) |
2 (2.7) |
1 (1.3) |
.02 |
||||
|
Coronary artery disease, % |
41 (6.7) |
15 (4.9) |
9 (6.1) |
6 (8.0) |
11 (14.1) |
.04 |
||||
|
Atrial fibrillation, % |
61 (10.1) |
27 (8.8) |
21 (14.2) |
7 (9.3) |
6 (7.7) |
.28 |
||||
|
Previous stroke, % |
162 (26.7) |
78 (25.5) |
38 (25.7) |
23 (30.7) |
23 (29.5) |
.75 |
||||
|
Chronic kidney disease, % |
16 (2.6) |
4 (1.3) |
3 (2.0) |
3 (4.0) |
6 (7.7) |
.01 |
||||
|
Current smoker, % |
132 (21.8) |
72 (23.5) |
30 (20.3) |
11 (14.7) |
19 (24.4) |
.35 |
||||
|
Ex-smoker, % |
103 (17.0) |
53 (17.3) |
22 (14.9) |
12 (16.0) |
16 (20.5) |
.74 |
||||
|
Physiology |
||||||||||
|
Systolic blood pressure, mm Hg |
142.0 +- 25.4 |
140.9 +- 25.0 |
143.7 +- 24.4 |
142.1 +- 28.0 |
143.3 +- 26.2 |
.69 |
||||
|
Diastolic blood pressure, mm Hg |
82.2 +- 12.9 |
82.0 +- 12.6 |
81.6 +- 13.6 |
82.5 +- 13.0 |
84.2 +- 12.4 |
.53 |
||||
|
Pulse rate, bpm |
79.1 +- 12.9 |
78.8 +- 12.8 |
78.6 +- 13.9 |
81.9 +- 11.1 |
78.7 +- 12.6 |
.27 |
||||
|
Respiratory rate, bpm |
18.6 +- 1.2 |
18.6 +- 1.2 |
18.6 +- 1.3 |
18.7 +- 1.4 |
18.4 +- 1.0 |
.53 |
||||
|
Body temperature, ?C |
36.5 +- 0.4 |
36.4 +- 0.5 |
36.5 +- 0.4 |
36.5 +- 0.4 |
36.5 +- 0.4 |
.86 |
||||
|
Mentality–alert, % |
523 (86.2) |
273 (89.2) |
117 (79.1) |
65 (86.7) |
68 (87.2) |
.07 |
||||
|
Mentality–verbal, % |
56 (9.2) |
25 (8.2) |
19 (12.8) |
7 (9.3) |
5 (6.4) |
|||||
|
Mentality–pain and unresponsive, % |
28 (4.6) |
8 (2.6) |
12 (8.1) |
3 (4.0) |
5 (6.4) |
|||||
|
Interval from Sx onset to ED, h |
6.2 (1.9-24) |
5.3 (1.9-26.1) |
7.9 (2.0-24) |
7.1 (2.0-24) |
7.8 (2.0-24) |
.84 |
||||
|
NIHSS at presentation |
4.2 +- 4.2 |
3.8 +- 3.9 |
5.4 +- 4.7 |
4.4 +- 4.2 |
3.7 +- 3.7 |
b.01 |
||||
|
stroke type (TOAST), % |
.17 |
|||||||||
|
I |
173 (28.6) |
97 (31.7) |
39 (26.4) |
15 (20.0) |
22 (28.6) |
|||||
|
II |
42 (6.9) |
23 (7.5) |
13 (8.8) |
4 (5.3) |
2 (2.6) |
|||||
|
III |
273 (45.1) |
121 (39.5) |
72 (48.7) |
43 (57.3) |
37 (48.1) |
|||||
|
IV |
8 (1.3) |
5 (1.6) |
3 (2.0) |
0 |
0 |
|||||
|
V |
110 (18.2) |
60 (19.6) |
21 (14.2) |
13 (17.3) |
16 (20.8) |
|||||
|
Treatment and complications |
||||||||||
|
IVT, % |
76 (12.5) |
42 (13.7) |
21 (14.2) |
7 (9.3) |
6 (7.7) |
.37 |
||||
|
Interval from door to IVT, min |
61.5 (42.0-90.5) |
58.5 (42.0-92.0) |
67.0 (53.0-93.0) |
56.0 (34.0-81.0) |
37.0 (30.0-68.0) |
.26 |
||||
|
TFCA, % |
132 (21.8) |
70 (22.9) |
30 (20.3) |
15 (20.0) |
17 (21.8) |
.90 |
||||
|
Time from door to TFCA, h |
3.3 (1.9-45.5) |
4.5 (2.2-50.8) |
2.8 (1.7-4.6) |
2.2 (1.7-22.8) |
6.4 (2.5-46.4) |
.15 |
||||
|
Hospital LOS, d |
6.9 (5.0-10.1) |
6.8 (5.0-9.1) |
7.5 (5.6-11.8) |
7.0 (5.6-12.2) |
6.9 (4.9-11.6) |
.07 |
||||
|
Symptomatic ICH, % |
27 (4.5) |
14 (4.6) |
10 (6.8) |
1 (1.4) |
2 (2.6) |
.24 |
||||
|
Serious/life-threatening hemorrhage, % |
4 (0.7) |
2 (0.7) |
1 (0.7) |
1 (1.4) |
0 |
.79 |
||||
|
Abbreviations: Sx, symptom; LOS, length of stay. |
||||||||||
|
Boldface in table means the statistical significance. |
||||||||||
Laboratory findings for the enrolled patients
|
All |
NGNO |
HGNO |
NGHO |
HGHO |
P |
|||||
|
No. |
607 (100%) |
306 (50.4%) |
148 (24.4%) |
75 (12.4%) |
78 (12.9%) |
|||||
|
Glucose, mg/dL |
148.8 +- 66.3 |
113.2 +- 16.2 |
189.9 +- 50.3 |
116.7 +- 16.9 |
241.6 +- 102.2 |
b.01 |
||||
|
N180 mg/dL (10 mmol/L) |
114 (18.8) |
0 |
61 (41.2) |
0 |
53 (68.0) |
b.01 |
||||
|
N270 mg/dL (15 mmol/L) |
35 (5.8) |
0 |
15 (10.1) |
0 |
20 (25.6) |
b.01 |
||||
|
N360 mg/dL (20 mmol/L) |
12 (2.0) |
0 |
1 (0.7) |
0 |
11 (14.1) |
b.01 |
||||
|
Osmolality, mOsm/kg |
291.2 +- 6.9 |
287.9 +- 4.4 |
289.0 +- 4.6 |
299.3 +- 4.7 |
300.3 +- 5.8 |
b.01 |
||||
|
N305 mOsm/kg |
24 (4.0) |
0 |
0 |
11 (14.7) |
13 (16.7) |
b.01 |
||||
|
N310 mOsm/kg |
6 (1.0) |
0 |
0 |
1 (1.3) |
5 (6.4) |
b.01 |
||||
|
N320 mOsm/kg |
1 (0.2) |
0 |
0 |
0 |
1 (1.3) |
.25 |
||||
|
Sodium, mmol/L |
138.1 +- 3.0 |
137.8 +- 2.2 |
136.1 +- 2.6 |
142.4 +- 2.3 |
139.0 +- 3.2 |
b.01 |
||||
|
N145 mmol/L |
10 (1.7) |
0 |
0 |
7 (9.3) |
3 (3.9) |
b.01 |
||||
|
N150 mmol/L |
1 (0.2) |
0 |
0 |
0 |
1 (1.3) |
.25 |
||||
|
BUN, mg/dL |
18.7 +- 8.1 |
16.7 +- 5.6 |
17.4 +- 6.1 |
21.5 +- 11.6 |
25.2 +- 10.8 |
b.01 |
||||
|
N28 mg/dL |
54 (8.9) |
12 (3.9) |
9 (6.1) |
11 (14.7) |
22 (28.2) |
b.01 |
||||
|
N42 mg/dL |
10 (1.7) |
0 |
1 (0.7) |
3 (4.0) |
6 (7.7) |
b.01 |
||||
|
N56 mg/dL |
3 (0.5) |
0 |
0 |
2 (2.7) |
1 (1.3) |
.01 |
||||
|
Cr, mg/dL |
0.9 +- 0.8 |
0.9 +- 0.7 |
0.9 +- 0.5 |
1.0 +- 0.9 |
1.3 +- 1.4 |
b.01 |
||||
|
BUN/Cr ratio |
22.7 +- 9.2 |
22.1 +- 8.7 |
21.8 +- 8.4 |
25.2 +- 8.9 |
24.9 +- 11.5 |
b.01 |
||||
|
HbA1c, % |
6.3 +- 1.3 |
5.8 +- 0.6 |
7.0 +- 1.7 |
5.8 +- 0.7 |
7.4 +- 1.6 |
b.01 |
||||
|
Lactate, mmol/L |
1.5 +- 0.9 |
1.4 +- 0.7 |
1.8 +- 1.1 |
1.5 +- 1.4 |
1.8 +- 0.7 |
b.01 |
||||
|
Hs-CRP, mg/L |
6.3 +- 21.8 |
6.3 +- 19.3 |
6.5 +- 19.8 |
4.8 +- 14.2 |
7.7 +- 36.3 |
.88 |
||||
|
Ammonia, mcg/dL |
35.2 +- 14.1 |
35.3 +- 14.6 |
34.6 +- 13.3 |
35.8 +- 14.6 |
35.4 +- 13.3 |
.93 |
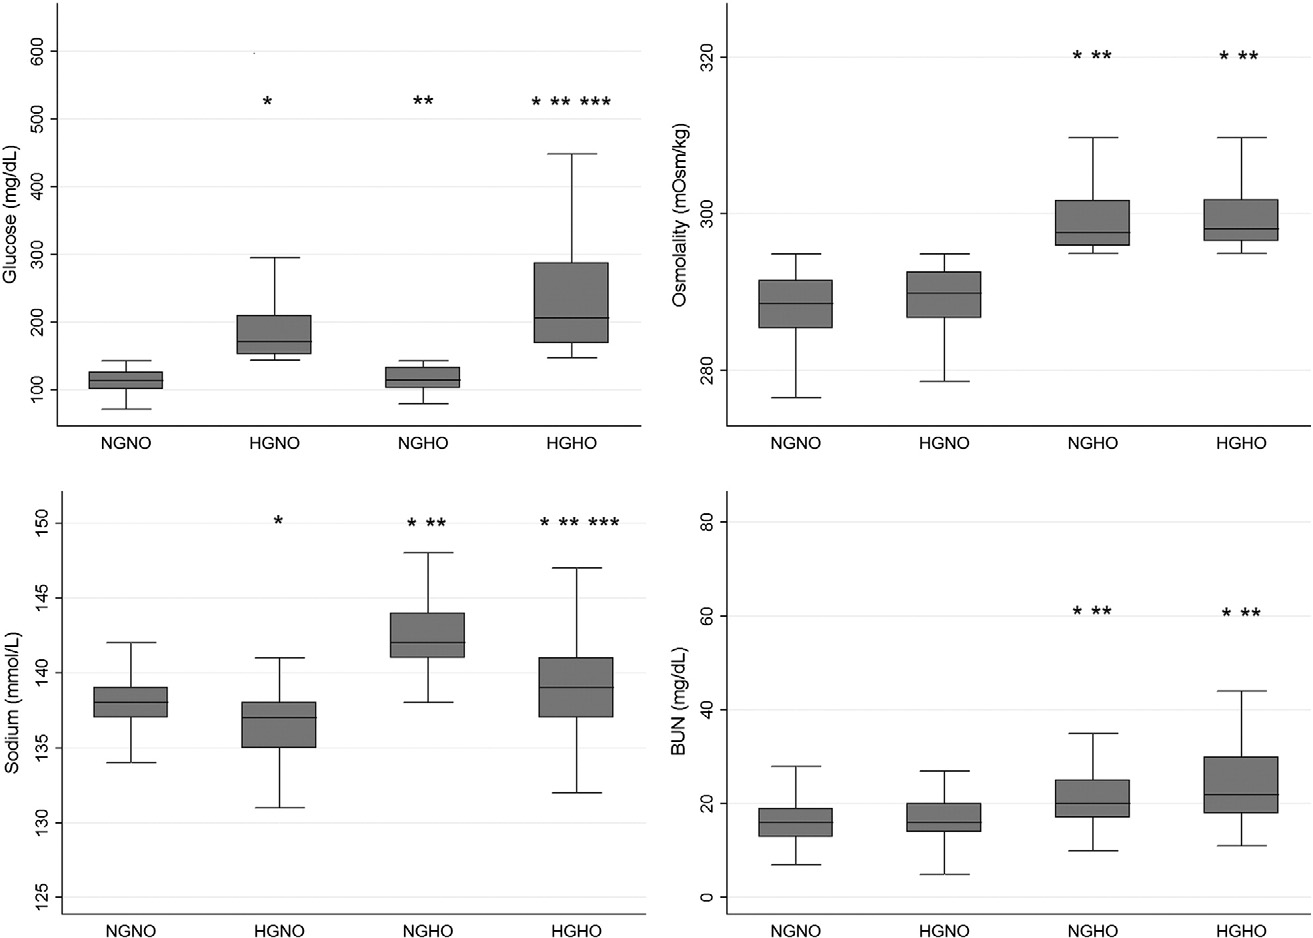
Fig. 2. Comparisons of laboratory findings among subgroups classified based on the existence of hyperglycemia and hyperosmolality. * indicated significance of b.01 compared with NGNO.
** indicated significance of b.01 compared with HGNO. *** indicated significance of b.01 compared with NGHO. No mark means that there is no statistically significant difference. The horizontal lines represent the lower adjacent value, 25th percentile, median, 75th percentile, and upper adjacent value.
outcomes, all subgroups were associated with poor outcome at dis- charge and only the HGNO group was associated with death at dis- charge and after 6 months. In the multivariable logistic regression analysis, HGNO and HGHO remained significant factors for primary out- comes (adjusted odds ratio [AOR], 2.08; 95% CI, 1.16-3.71) and 2.93 (1.45-5.91), respectively). Both groups were also associated with poor outcome at discharge. The AORs of the HGHO group were higher than those of the HGNO group for poor outcomes at 2 different time points.
Regarding death at discharge and 6 months, no groups showed signifi- cance. The covariates are displayed in detail in Table 4.
Discussion
Hyperglycemia is harmful among AIS patients. Even at various cutoff values for serum glucose, and among diabetic and nonDiabetic patients,

Fig. 3. The locally weighted scatterplot smoothing curve analysis demonstrated a near-linear relationship between the serum glucose level and cumulative frequency of poor outcome at 6 months over a glucose level above approximately 110 mg/dL. With respect to serum osmolality, a near-linear relationship was observed over an osmolality level above approximately 290 mOsm/kg.
Distribution of mRS at discharge and after 6 months among subgroups classified based on the existence of hyperglycemia and hyperosmolality
|
All |
NGNO |
HGNO |
NGHO |
HGHO |
P |
|||||
|
No., (%) |
607 (100%) |
306 (50.4%) |
148 (24.4%) |
75 (12.4%) |
78 (12.9%) |
|||||
|
mRS at discharge, n (%) 0 |
68 (11.2) |
45 (14.7) |
6 (4.1) |
7 (9.3) |
10 (12.8) |
b.01 |
||||
|
1 |
153 (25.2) |
96 (31.4) |
28 (18.9) |
18 (24.0) |
11 (14.1) |
|||||
|
2 |
138 (22.7) |
65 (21.2) |
33 (22.3) |
16 (21.3) |
24 (30.8) |
|||||
|
3 |
96 (15.8) |
43 (14.1) |
27 (18.2) |
14 (18.7) |
12 (15.4) |
|||||
|
4 |
112 (18.5) |
45 (14.7) |
39 (26.4) |
14 (18.7) |
14 (18.0) |
|||||
|
5 |
10 (1.7) |
3 (1.0) |
4 (2.7) |
1 (1.3) |
2 (2.6) |
|||||
|
6 mRS at 6 months, n (%) |
30 (4.9) |
9 (2.9) |
11 (7.4) |
5 (6.7) |
5 (6.4) |
b.01 |
||||
|
0 |
98 (16.1) |
63 (20.6) |
15 (10.1) |
8 (10.7) |
12 (15.4) |
|||||
|
1 |
173 (28.5) |
106 (34.6) |
30 (20.3) |
24 (32.0) |
13 (16.7) |
|||||
|
2 |
115 (19.0) |
55 (18.0) |
29 (19.6) |
11 (14.7) |
20 (25.6) |
|||||
|
3 |
76 (12.5) |
28 (9.2) |
23 (15.5) |
13 (17.3) |
12 (15.4) |
|||||
|
4 |
100 (16.5) |
39 (12.8) |
37 (25.0) |
11 (14.7) |
13 (16.7) |
|||||
|
5 |
6 (1.0) |
2 (0.7) |
0 |
3 (4.0) |
1 (1.3) |
|||||
|
6 |
39 (6.4) |
13 (4.3) |
14 (9.5) |
5 (6.7) |
7 (9.0) |
hyperglycemia showed a significant association with poor outcomes [34,35,36,37]. Several mechanisms have been suggested for the neuro- toxic effect of hyperglycemia. Hyperglycemia increased cerebral lactate through anaerobic cerebral glucose metabolism, and lactate accumulation led to intracellular acidosis [38,39]. Brain tissue acidosis impairs mito- chondrial function [40] and enhances Ischemic injury by lipid peroxida- tion and free radical formation [41]. These neurotoxic effects are important in the penumbra area and result in larger infarct sizes [42]. Hy- perglycemia might disrupt the blood-brain barrier and promote cerebral edema. [43] Hyperglycemia might increase the availability of glutamate, leading to an excessive influx of calcium through ion channels, eventually resulting in cell death [44,45]. Glucose-mediated proinflammatory and procoagulant effects have also been suggested, whereby glucose might in- crease nuclear factor ?B [46], activator protein-1, early growth response-1 [47], nitric oxide [48], and interleukin 6 and tumor necrosis factor levels
[49] In addition, Kawai and colleagues [50] reported an approximately 25% reduction in cerebral plasma volume after intraperitoneal adminis- tration of glucose in Middle cerebral artery occluded rats.
In contrast to hyperglycemia, there are few studies evaluating the serum osmolality among stroke patients, and these studies enrolled few patients. [51,52,53]. With respect to poor outcome, only a single study evaluated the association between poor outcome at 3 months and serum osmolality among AIS patients. Bhalla and colleagues [13] observed that the admission plasma osmolality N296 mOsm/kg was sig- nificantly associated with mortality (OR 2.4, 95% CI 1.0-5.9) after

Fig. 4. Distribution of the primary outcomes among subgroups classified based on the existence of hyperglycemia and hyperosmolality. * indicated significance of b.001 compared with NGNO. The P value was .051 for NGHO compared with NGNO and .069 for NGHO compared with HGNO.
adjusting for age, sex, stroke severity, Barthel Index before stroke, plas- ma glucose as continuous variable, history of diabetes, and stroke sub- type among 167 AIS patients.
Among AIS patients, increased serum Na concentrations (hypernatremia) can increase serum osmolality as well as increased serum glucose levels (hyperglycemia). Natochin and colleagues [53] re- ported hypernatremia evolution after stroke attack, showing that hyperosmolality and hypersodiumemia developed among ischemic stroke patients, while Ca, K, Mg ions level remained stable.
Why does increased osmolality affect the outcome among ischemic stroke patients? Hypernatremia itself could provoke cellular shrinking and dehydration [54]. In addition, Bhalla and colleagues [13] suggested that decreased oral intake of water under disturbed conscious or
Table 4
Logistic regression analysis for poor outcome (mRS >=2) and mortality (mRS = 6) at dis- charge and after 6 months
Unadjusted odd ratio P AOR P
Primary outcome mRS >=2 at 6 months
|
NGNO |
Reference |
Reference |
||
|
HGNO |
2.82 (1.86-4.28) |
b.001 |
2.08 (1.16-3.71) |
.013 |
|
NGHO |
1.66 (1.00-2.76) |
.052 |
1.35 (0.73-2.52) |
.343 |
|
HGHO |
2.62 (1.55-4.43) |
b.001 |
2.93 (1.45-5.91) |
.003 |
Secondary outcomes Death at discharge
|
NGNO |
Reference |
Reference |
||
|
HGNO |
2.65 (1.07-6.54) |
.035 |
1.41 (0.43-4.67) |
.571 |
|
NGHO |
2.36 (0.77-7.25) |
.135 |
3.22 (0.73-14.16) |
.122 |
|
HGHO |
2.26 (0.74-6.95) |
.155 |
0.99 (0.18-5.58) |
.994 |
|
mRS >=2 at discharge NGNO Reference |
Reference |
|||
|
HGNO |
2.87 (1.84-4.47) |
b.001 |
1.89 (1.05-3.39) |
.033 |
|
NGHO |
1.71 (1.01-2.90) |
.048 |
1.32 (0.71-2.47) |
.377 |
|
HGHO |
2.32 (1.34-4.01) |
.003 |
2.16 (1.07-4.38) |
.032 |
|
Death at 6 months |
||||
|
NGNO |
Reference |
Reference |
||
|
HGNO |
2.35 (1.08-5.15) |
.032 |
1.20 (0.45-3.24) |
.717 |
|
NGHO |
1.61 (0.56-4.67) |
.380 |
1.34 (0.35-5.11) |
.668 |
|
HGHO |
2.22 (0.86-5.77) |
.101 |
1.13 (0.29-4.34) |
.860 |
Multivariable model for mRS >=2 at 6 months included age category, male, history of hyper- tension, DM, dyslipidemia, atrial fibrillation, previous stroke, smoker, mental status, NIHSS, TOAST, IV thrombolysis, ICH, HbA1c, hs-CRP, and ammonia.
Multivariable model for death at discharge included age category, atrial fibrillation, mental status, NIHSS, TOAST, TFCA, ICH, BUN/Cr ratio, lactate, and hs-CRP.
Multivariable model for mRS >=2 at discharge included age category, male, DM, dyslipid- emia, atrial fibrillation, previous stroke, mental status, NIHSS, TOAST, ICH, HbA1c, hs- CRP, and ammonia.
Multivariable model for death at discharge and after 6 months included age category, atrial
fibrillation, mental status, NIHSS, TOAST, TFCA, ICH, Cr, lactate, and hs-CRP.
dysphagic condition resulted in a dehydrated status and increased osmo- lality. Other potential explanations involve diuresis (osmotic diuresis), reflecting the fact that hyperosmolality might worsen intravascular vol- ume depletion which could be exacerbated under conditions of limited oral water intake [55]. Because the penumbra is susceptible to cerebral blood flow, Volume depletion, reflecting decreased oral water intake and osmotic diuresis might be deleterious to the outcome among AIS pa- tients [56]. Also, Brocker and colleagues suggested that hyperosmolality triggers cell shrinkage, oxidative stress, protein carbonylation, mitochon- drial depolarization, DNA damage, and cell cycle arrest [57].
Because serum glucose level is one of the major determinants of os- molality, hyperglycemia could accompany hyperosmolality. Therefore, to reveal the precise association between poor outcome and hypergly- cemia or hyperosmolality, researches should exclude the mutual effects of hyperglycemia and hyperosmolality. To our knowledge, this study is the first report evaluating the association between poor outcome and hyperglycemia without hyperosmolality (HGNO) and hyperosmolality without hyperglycemia (NGHO) among AIS patients.
The findings of the present study are interesting. The HGNO group showed more frequent poor outcomes than the NGNO group. However, there was no significant difference in the poor outcome between the NGHO and NGNO groups, although a trend was observed (P = .051). The multivariable logistic regression analysis revealed that HGNO remained a significant factor for poor outcome (AOR, 2.08; 95% CI, 1.16-3.71), but NGHO did not (AOR, 1.35; 95% CI, 0.73-2.52). With re-
spect to hyperglycemia, findings consistent with previous reports were shown, even after excluding the effect of hyperosmolality, but hyperosmolality was not.
In the present study cohort, severe hypernatremia was scarce, and only 1 case showed serum sodium levels above 150 mmol/L. The serum sodium level was significantly higher in the NGHO group than in the NGNO group (142.4 +- 2.3 vs 137.8 +- 2.2 mmol/L), but the mean sodium value of the NGHO group was still in the normal range (135-145 mmol/L). The mean difference of sodium level between the NGNO and NGHO groups was 4.4 mmol/L, and the osmolality difference was 8.8 mOsm/kg, similar to the mean difference in the osmolality level between the NGNO and NGHO groups (11.4 mOsm/kg). Therefore, it is likely that the poor effect of hyperosmolality derived from hypernatremia would not be observed in the present study, considering that hypernatremia is the major culprit of hyperosmolality.
Another unique finding in the present study was that AORs for poor outcomes were higher in the HGHO group than that in the HGNO group. This finding implies an additive effect between the 2 groups. The mean differences of osmolality, sodium, glucose, and BUN were 11.3 mOsm/ kg, 2.9 mmol/L, 51.7 mg/dL, and 7.8 mg/dL, respectively. The calculated incremental contribution for the osmolality of sodium, glucose, and BUN were 5.8, 2.9, and 2.8 mOsml/kg, respectively. Thus, the differences in the sodium levels primarily reflect differences in the osmolality. Howev- er, although cases of extremely high sodium and BUN levels were also few in the HGHO group, considerable cases of extremely high glucose levels were observed in the same group. Therefore, we propose that the additive effect for poor outcome shown in the HGHO group com- pared with the HGNO group reflected the proportion of severe hyper- glycemia, not the difference in osmolality.
The present study had some limitations. First, we used calculated os- molality rather than measured osmolality because serum osmolality was not a routine laboratory test in the study hospital. Although several previous studies have indicated the reliable correlation between calcu- lated osmolality and measure osmolality [22,23], further evaluation using measured osmolality is warranted. Second, in contrast to poor outcomes, mortality differences were not shown in the present study. This finding was not expected because of the small number of death cases in the enrolled cohort. In addition, the wide CIs, observed in the analysis of the secondary outcomes, implied an inadequate sample size, limiting definitive conclusions about secondary outcomes. Patients whose neurological status at 6 months was not determined could also
bias the results. Third, we did not obtain variables during hospital stays or treatment courses that specifically targeted hyperglycemia or hyperosmolality. Hyperglycemia or hyperosmolality occurring during hospital stays and not at presentation to the ED could also affect the out- comes. Moreover, possible medical conditions accompanied by severe hyperglycemia, such as diabetic ketoacidosis or hyperosmolar coma, would be a concern for death. Furthermore, we did not collect data on physical/occupational therapy which could be potential confounder to outcome. Fourth, the retrospective observational design is inherently limited given that researchers might have impaired the procurement of some data and introduced biases. However, most of the variables ret- rospectively collected were objective and easy to retrieve, and re- searchers tried to avoid potential biases. Fifth, the abstractor was not blinded to the outcome. Lastly, in the present study, outcome was mea- sured using mRS. There are concerns regarding the potential of interob- server variability [58]. Despite the argument of uncertain reliability, however, mRS is used widely in lots of studies including the present manuscript [18-20].
In conclusion, we observed that hyperglycemia was associated with poor outcome, even after excluding the effect of hyperosmolality. How- ever, hyperosmolality without hyperglycemia was not associated with poor outcomes. An additive effect, likely derived from severe hypergly- cemia, was observed, considering the larger AOR of HGHO compared with HGNO. There were few cases of severe hypernatremia in the pres- ent study cohort; therefore, the effect of hypernatremia would not be observed in the present study.
Author Contributions
SO and SJ designed the study. SO supervised the overall data collec- tion process, had full access to all the data, and is responsible for the in- tegrity of the data. BP conducted the data analysis. SJ drafted the initial version of the manuscript. All authors provided substantial review and feedback on the final version of the manuscript. SJ is responsible for the manuscript.
All authors have read and approved the submitted manuscript. This manuscript has not been submitted nor been published elsewhere in whole or in part, except as an abstract (if relevant).
References
- Koton S, Schneider AL, Rosamond WD, Shahar E, Sang Y, Gottesman RF. Coresh 2. Stroke incidence and mortality trends in US communities, 1987 to 2011. JAMA 2014;312(3):259-68. http://dx.doi.org/10.1001/jama.2014.7692.
- Towfighi A, Saver JL. Stroke declines from third to fourth leading cause of death in the United States: historical perspective and challenges ahead. Stroke 2011;42(8): 2351-5.
- Whiteley W, Chong WL, Sengupta A, Sandercock P. Blood markers for the prognosis of ischemic stroke: a systematic review. Stroke 2009;40:e380-9.
- Williams LS, Rotich J, Qi R, Fineberg N, Espay A, Bruno A, et al. Effects of admission hyperglycemia on mortality and costs in acute ischemic stroke. Neurology 2002; 59(1):67-71.
- Scott JF, Robinson GM, French JM, O’Connell JE, Alberti KG, Gray CS. Glucose potassi- um Insulin infusions in the treatment of acute stroke patients with mild to moderate hyperglycemia: the Glucose Insulin in Stroke Trial (GIST). Stroke 1999;30(4):793-9.
- Bruno A, Biller J, Adams Jr HP, Clarke WR, Woolson RF, Williams LS, et al. Acute blood glucose level and outcome from ischemic stroke. Trial of ORG 10172 in Acute Stroke Treatment (TOAST) investigators. Neurology 1999;52(2):280-4.
- Weir CJ, Murray GD, Dyker AG, Lees KR. Is hyperglycaemia an independent predictor of poor outcome after acute stroke? Results of a long-term follow up study. BMJ 1997;314(7090):1303-6.
- Bruno A, Levine SR, Frankel MR, Brott TG, Lin Y, Tilley BC, et al. Admission glucose level and clinical outcomes in the NINDS rt-PA Stroke Trial. Neurology 2002;59(5): 669-74.
- Dave JA, Engel ME, Freercks R, Peter J, May W, Badri M, et al. Abnormal glucose me- tabolism in non-diabetic patients presenting with an acute stroke: prospective study and systematic review. QJM 2010;103(7):495-503. http://dx.doi.org/10.1093/ qjmed/hcq062 [Epub 2010 Apr 28].
- Lindsberg PJ, Roine RO. Hyperglycemia in acute stroke. Stroke 2004;35(2):363-4.
- Jauch EC, Saver JL, Adams Jr HP, Bruno A, Connors JJ, Demaerschalk BM, et al. Guide- lines for the early management of patients with acute ischemic stroke: a guideline for healthcare professionals from the American Heart Association/American Stroke Association. Stroke 2013;44(3):870-947. http://dx.doi.org/10.1161/STR. 0b013e318284056a [Epub 2013 Jan 31].
- European Stroke Initiative Executive Committee, EUSI Writing Committee, Olsen TS, Langhorne P, Diener HC, Hennerici M, et al. European stroke initiative recommenda- tions for stroke management-update 2003. Cerebrovasc Dis 2003;16(4):311-37 [PMID: 14584488].
- Bhalla A, Sankaralingam S, Dundas R, Swaminathan R, Wolfe CD, Rudd AG. Influence of raised plasma osmolality on clinical outcome after acute stroke. Stroke 2000; 31(9):2043-8.
- European Stroke Organisation (ESO) Executive Committee: ESO Writing Committee. Guidelines for management of ischaemic stroke and transient ischaemic attack 2008. Cerebrovasc Dis 2008;25:457-507.
- Adams Jr HP, Bendixen BH, Kappelle LJ, Biller J, Love BB, Gordon DL, et al. Classifica- tion of subtype of acute ischemic stroke. Definitions for use in a multicenter clinical trial. Toast. Trial of org 10172 in acute stroke treatment. Stroke 1993;24:35-41.
- Brott T, Adams Jr HP, Olinger CP, Marler JR, Barsan WG, Biller J, et al. Measurements of acute cerebral infarction: a clinical examination scale. Stroke 1989;20:864-70.
- Van Swieten JC, Koudstaal PJ, Visser MC, Schouten HJ, van Gijn J. Interobserver agreement for the assessment of handicap in stroke patients. Stroke 1988;19:604-7.
- Yoo SH, Kim JS, Kwon SU, Yun SC, Koh JY, Kang DW. Undernutrition as a predictor of poor clinical outcomes in acute ischemic stroke patients. Arch Neurol 2008;65(1): 39-43. http://dx.doi.org/10.1001/archneurol.2007.12.
- Khatri P, Conaway MR, Johnston KC, Acute Stroke Accurate Prediction Study (ASAP) Investigators. Ninety-day outcome rates of a prospective cohort of consecutive pa- tients with mild ischemic stroke. Stroke 2012;43(2):560-2. http://dx.doi.org/10. 1161/STROKEAHA.110.593897 [Epub 2011 Nov 3].
- Nedeltchev K, der Maur TA, Georgiadis D, Arnold M, Caso V, Mattle HP, et al. Ischae- mic stroke in young adults: predictors of outcome and recurrence. J Neurol Neurosurg Psychiatry 2005;76(2):191-5.
- Gilbert EH, Lowenstein SR, Koziol-McLain J, Barta DC, Steiner J. Chart reviews in emergency medicine research: where are the methods? Ann Emerg Med 1996; 27:305-8.
- Rasouli M, Kalantari KR. Comparison of methods for calculating serum osmolality: Multivariate linear regression analysis. Clin Chem Lab Med 2005;43(6):635-40.
- Worthley LI, Guerin M, Pain RW. For calculating osmolality, the simplest formula is the best. Anaesth Intensive Care 1987;15(2):199-202.
- Gray CS, French JM, Bates D, Cartlidge NE, Venables GS, James OF. Increasing age, di- abetes mellitus and recovery from stroke. Postgrad Med J 1989;65(768):720-4.
- Bodo BA. Robust graphical methods for diagnosing trend in irregularly spaced water quality time series. Environ Monit Assess 1989;13(2-3):407-28. http://dx.doi.org/ 10.1007/BF00394242.
- Wang TJ, Massaro JM, Levy D, Vasan RS, Wolf PA, D’Agostino RB, et al. A risk score for predicting stroke or death in individuals with new-onset atrial fibrillation in the community: the Framingham Heart Study. JAMA 2003;290:1049-56.
- Kissela BM, Khoury J, Kleindorfer D, Woo D, Schneider A, Alwell K, et al. Epidemiol- ogy of ischemic stroke in patients with diabetes: the greater Cincinnati/Northern Kentucky Stroke Study. Diabetes Care 2005;28:355-9.
- Curb JD, Abbott RD, Rodriguez BL, Masaki KH, Chen R, Popper JS, et al. High density lipoprotein cholesterol and the risk of stroke in elderly men: the Honolulu Heart Program. Am J Epidemiol 2004;160:150-7.
- Petrea RE, Beiser AS, Seshadri S, Kelly-Hayes M, Kase CS, Wolf PA. Gender differences in stroke incidence and poststroke disability in the Framingham Heart Study. Stroke 2009;40:1032-7.
- Harwell TS, Blades LL, Oser CS, Dietrich DW, Okon NJ, Rodriguez DV, et al. Perceived risk for developing stroke among older adults. Prev Med 2005;41:791-4.
- Jo S, Jeong T, Lee JB, Jin YH, Yoon J, Jun YK, et al. Initial hyperlactatemia in the ED is as- sociated with poor outcome in patients with ischemic stroke. Am J Emerg Med 2012; 30(3):449-55. http://dx.doi.org/10.1016/j.ajem.2011.12.019 [Epub 2012 Feb 4].
- Zhou J, Wu J, Zhang J, Xu T, Zhang H, Zhang Y, et al. Association of stroke clinical out- comes with coexistence of hyperglycemia and biomarkers of inflammation. J Stroke Cerebrovasc Dis 2015;24(6):1250-5. http://dx.doi.org/10.1016/j.jstrokecerebrovasdis. 2015.01.028 [Epub 2015 Apr 20].
- von Elm E, Altman DG, Egger M, Pocock SJ, Gotzsche PC, Vandenbroucke JP, et al. The Strengthening the Reporting of Observational Studies in Epidemiology (STROBE) statement: guidelines for reporting observational studies. Lancet 2007;370(9596): 1453-7.
- Masrur S, Cox M, Bhatt DL, Smith EE, Ellrodt G, Fonarow GC, et al. Association of acute and chronic hyperglycemia with acute ischemic stroke outcomes post- thrombolysis: findings from get with the guidelines-stroke. J Am Heart Assoc 2015;4(10), e002193. http://dx.doi.org/10.1161/JAHA.115.002193.
- Matchar DB, Divine GW, Heyman A, Feussner JR. The influence of hyperglycemia on outcome of cerebral infarction. Ann Intern Med 1992;117(6):449-56.
- Sacco RL, Shi T, Zamanillo MC, Kargman DE. Predictors of mortality and recurrence after hospitalized cerebral infarction in an urban community: the Northern Manhat- tan Stroke Study. Neurology 1994;44(4):626-34.
- Toni D, Sacchetti ML, Argentino C, Gentile M, Cavalletti C, Frontoni M, et al. Does hyperglycaemia play a role on the outcome of acute ischaemic stroke patients? J Neurol 1992;239(7):382-6.
- Levine SR, Welch KM, Helpern JA, Chopp M, Bruce R, Selwa J, et al. Prolonged dete- rioration of ischemic brain Energy metabolism and acidosis associated with hyper- glycemia: human cerebral infarction studied by serial 31P NMR spectroscopy. Ann Neurol 1988;23(4):416-8.
- Kagansky N, Levy S, Knobler H. The role of hyperglycemia in acute stroke. Arch Neurol 2001;58(8):1209-12.
- Anderson RE, Tan WK, Martin HS, Meyer FB. Effects of glucose and PaO2 modulation on cortical intracellular acidosis, NADH redox state, and infarction in the ischemic penumbra. Stroke 1999;30(1):160-70.
- Siesjo BK, Bendek G, Koide T, Westerberg E, Wieloch T. Influence of acidosis on lipid peroxidation in brain tissues in vitro. J Cereb Blood Flow Metab 1985;5(2):253-8.
- Alvarez-Sabin J, Molina CA, Montaner J, Arenillas JF, Huertas R, Ribo M, et al. Effects of Admission hyperglycemia on stroke outcome in reperfused tissue plasminogen activator–treated patients. Stroke 2003;34(5):1235-41 [Epub 2003 Apr 3].
- Dietrich WD, Alonso O, Busto R. Moderate hyperglycemia worsens acute blood-brain barrier injury after forebrain ischemia in rats. Stroke 1993;24(1):111-6.
- Li PA, Shuaib A, Miyashita H, He QP, Siesjo BK, Warner DS. Hyperglycemia enhances extracellular glutamate accumulation in rats subjected to forebrain ischemia. Stroke 2000;31(1):183-92.
- Araki N, Greenberg JH, Sladky JT, Uematsu D, Karp A, Reivich M. The effect of hypergly- cemia on intracellular calcium in stroke. J Cereb Blood Flow Metab 1992;12(3):469-76.
- Dhindsa S, Tripathy D, Mohanty P, Ghanim H, Syed T, Aljada A, et al. Differential ef- fects of glucose and alcohol on Reactive oxygen species generation and intranuclear nuclear factor-kappaB in mononuclear cells. Metabolism 2004;53(3):330-4.
- Aljada A, Ghanim H, Mohanty P, Syed T, Bandyopadhyay A, Dandona P. Glucose in- take induces an increase in activator protein 1 and early growth response 1 binding activities, in the expression of tissue factor and matrix metalloproteinase in mono- nuclear cells, and in plasma tissue factor and matrix metalloproteinase concentra- tions. Am J Clin Nutr 2004;80(1):51-7.
- Brodsky SV, Morrishow AM, Dharia N, Gross SS, Goligorsky MS. Glucose scavenging of nitric oxide. Am J Physiol Renal Physiol 2001;280(3):F480-6.
- Morohoshi M, Fujisawa K, Uchimura I, Numano F. Glucose-dependent interleukin 6 and tumor necrosis factor production by human peripheral blood monocytes in vitro. Diabetes 1996;45(7):954-9.
- Kawai N, Keep RF, Betz AL, Nagao S. Hyperglycemia induces progressive changes in the cerebral microvasculature and blood-brain barrier transport during focal cere- bral ischemia. Acta Neurochir Suppl 1998;71:219-21.
- Joynt RJ, Feibel JH, Sladek CM. antidiuretic hormone levels in stroke patients. Ann Neurol 1981;9(2):182-4.
- O’Neill PA, Davies I, Fullerton KJ, Bennett D. fluid balance in elderly patients follow- ing acute stroke. Age Ageing 1992;21(4):280-5.
- Natochin IV, Vilenskii BS, Shustin VA, Barsukov SV, Semenova GM, Grinevich TV, et al. Osmolality and ion concentration in the cerebrospinal fluid and blood serum in epilepsy and ischemic stroke. Zh Nevrol Psikhiatr Im S S Korsakova 1996;96(5):77-80.
- Adrogue HJ, Madias NE. Hypernatremia. N Engl J Med 2000;342(20):1493-9.
- Lang F. Osmotic diuresis. Ren Physiol 1987;10(3-4):160-73.
- Ramos-Cabrer P, Campos F, Sobrino T, Castillo J. Targeting the ischemic penumbra. Stroke 2011;42(1 Suppl.):S7-11. http://dx.doi.org/10.1161/STROKEAHA.110.596684.
- Brocker C, Thompson DC, Vasiliou V. The role of hyperosmotic stress in inflamma- tion and disease. Biomol Concepts 2012;3(4):345-64.
- Quinn TJ, Dawson J, Walters MR, Ledd KR. Reliability of the modified Rankin Scale: a systematic review. Stroke 2009;40(10):3393-5.