
Estimating maximum patient throughput at an ED scanner: Is three patients per hour the magic number?
 Patient throughput at”>American Journal of Emergency Medicine 40 (2021) 159-161
Contents lists available at ScienceDirect
American Journal of Emergency Medicine
journal homepage:
 Estimating maximum patient throughput at an ED scanner: Is three patients per hour the magic number?
Bryan A. Stenson, MD a,?, Joshua W. Joseph, MD a, Peter S. Antkowiak, MD a, Robin B. Levenson, MD b,
David T. Chiu, MD a, Leon D. Sanchez, MD a
a Beth Israel Deaconess Medical Center, Department of Emergency Medicine, One Deaconess Road, Boston, MA 02215, USA
b Beth Israel Deaconess Medical Center, Department of Radiology, Boston, MA, USA
..
Keywords:
Bottleneck
(C) 2020
Throughput Queuing
- Introduction
Computed tomography (CT) is a critical imaging modality in the emergency department (ED). Many Patient evaluations hinge on CT re- sults, and throughput at the scanner is integral to overall department flow. However, the throughput of a CT scanner is affected by many fac- tors. To run efficiently, image orders need to be placed promptly, lab or- ders often need to be placed and resulted (i.e. creatinine, hCG), results need to be communicated, scans need to be protocoled, patients need to be transported and scanned, and CT images need to be interpreted. Additionally, the arrival of unstable patients with immediate needs for imaging, such as patients with trauma or acute strokes, can further dis- rupt these workflows.
Accordingly, improving CT throughput is a topic of immense interest
for operations and quality improvement research in the ED. Previous re- search has focused on CT wait times, examining where bottlenecks are most prevalent [1-7]. Studies have also examined how the physical loca- tion of a scanner can affect timing [3,8], how obtaining a CT scan may af- fect overall length of stay [9], and the effect of Simulation models on CT workflow [10,11].
Understanding the baseline throughput of a CT scanner is essen-
tial to addressing larger bottlenecks and flow within the ED, be- cause if demand for a CT scanner approaches or exceeds its capacity, then it will become a source of increasing delays, irrespec- tive of attempts to optimize other bottlenecks. In this pilot study, we sought to describe the amount of active and idle time patients spent at an ED CT scanner suite to estimate its practical and theoret- ical throughput.
E-mail address: [email protected] (B.A. Stenson).
- Methods
This was an observational time-motion study [12] at an urban ac- ademic ED with 53,000 annual visits, conducted over a six-month period from August 2019 to January 2020. At our institution, approx- imately 32% of patients undergo a CT during their ED visit. The ED has a single helical multidetector CT scanner (General Electric Dis- covery CT750 HD). Patient encounters were directly observed by a trained physician observer, who recorded key timestamps during the encounter. These include the following time point measure- ments: patient enters room, patient moves onto CT table, scan start, scan stop, patient moves onto stretcher, patient exits room. Timestamps were verified with reference to the National Institute of Standards and Technology (NIST) Official U.S. Time website. Ob- servation periods ranged from 1-4 hours, and were performed as a random, representative convenience sample of days of the week and times during which the CT scanner was likely to be in cons- tant demand, in order to estimate maximum throughput. Observa- tions generally occurred between the hours of 1 PM and 9 PM. CT personnel were aware of the observer, and were explicitly informed that measurements were for planning, and not for performance evaluation.
Patient encounters included all CT imaging performed while the pa- tient was in the room. This ranged from single scans to “pan-scans” dur- ing a trauma.
We report descriptive statistics, with rates as mean and standard de- viation (SD), and time measurements as median and interquartile range (IQR). Skewness of the distributions was calculated using D’Agostino’s K-squared test. Means were compared using a two-tailed independent t-test. Comparisons between group medians with non-normalized distributions were tested via Mann-Whitney. Significance was
https://doi.org/10.1016/j.ajem.2020.10.012
0735-6757/(C) 2020
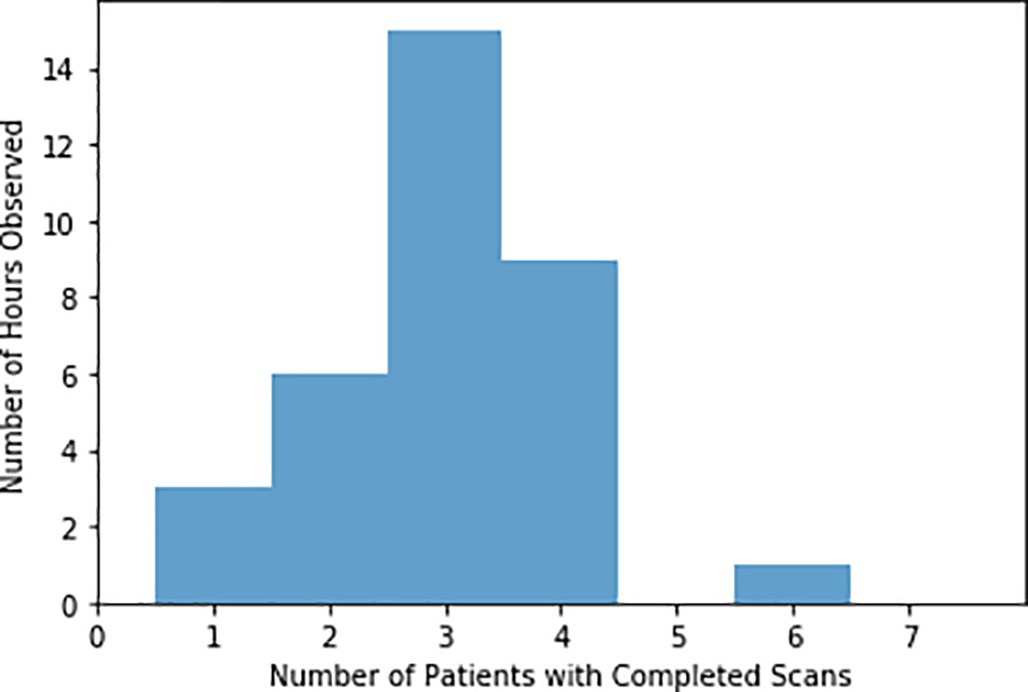
Fig. 1. Distribution of Completed Scans per Hour of Observation.
determined using a two-tailed ? < 0.01. Statistical analysis was con- ducted in SciPy.
- Results
102 patient encounters were observed during the study period. Obser- vations spanned 34 hours over 16 days. A mean of 3.2 patient encounters per hour (95% CI 2.8-3.5) were performed during observed times, with a backlog of 6.2 (95% CI 5.6-6.8) scans in queue per hour. The most scans performed in a single hour was 6, with all being images of the head and neck. The distributions of patients with completed scans per hour can be found in Fig. 1. During the observed times, 3.0 (95% CI 2.2 – 3.8) scans were ordered per hour, compared with 2.3 (95% CI 2.1 – 2.5) per hour across the whole day during the six-month period (p < 0.01).
During the hours for this convenience sample, there was always at least one patient in the queue. Upon additional review of ordering pat- terns for the entire time period during which the sample was obtained, the queue only went to zero – and remained so – between the hours of 2AM and 5AM.
The median time a patient spent in the CT scan room was 12.1 mi- nutes (IQR 9.6 – 17.7). The median time the room was empty after each scan was 3.6 minutes (IQR 0.9 – 9.4), for a sum total of 15.7 mi- nutes (IQR 10.4 – 27.0). These measurements demonstrated marked rightward skew (z=3.1, p < 0.01), with multiple outliers requiring a prolonged amount of time on the table to complete their scans, or to bring a subsequent patient into the room, despite the fact that multiple patients had outstanding orders for scans during these times. However, the total amount of time from CT order placement to CT scan image ac- quisition was normally distributed across patients (z=1.0, p = 0.3), with a mean of 134 minutes (95% CI 102-165).
Intravenous contrast made a substantial difference in scan times. Contrast was used with 58 patients (57%), with a median scan time
14.4 minutes per study (IQR 10.3-19.6), while Non-contrast studies had a median scan time of 10.0 minutes (IQR 7.9-13.0); the distributions in these two groups differed significantly (Mann-Whitney U=754, p < 0.01). A full categorization of scan times by type is listed in Table 1.
The fastest and most frequent scans conducted were non-contrast Head CT.scans. 56 total patients (54.9%) underwent a non-contrast head CT, frequently in combination with other imaging, such as non- contrast cervical spine scans for patients with falls, or prior to angio- graphic imaging in suspected stroke. Of these patients, 18 (32%) had only head imaging ordered, with a median time of only 8.1 minutes (IQR 7.2-11.6)
- Discussion
The process of obtaining a CT within the ED – from ordering to scan completion – is highly complex, with multiple potential sources of delay. However, even if all sources of delay outside of the CT scan are minimized, the rate at which patients can undergo a CT scan is funda- mentally limited by the amount of time it takes to perform a scan. In this pilot study, we sought to estimate the amount of time CT scans took for individual patients, independent of other factors, by direct observation.
For a majority of the hours during which the study was conducted, the CT scanner ran close to its measurED capacity, with an average rate of 3.2 scans per hour, not far from the calculated maximum of 3.8 scans per hour (60 minutes divided by the median time of 15.7 mi- nutes). In light of the fact that close to 3 scans per hour were ordered during the observed times of our study, it might seem surprising that there was often a much larger queue of patients waiting for CT scans.
However, even if the CT scanner examined in our study took exactly
15.7 minutes to perform each scan, such a rate would depend on having a patient with an order placed and ready to be scanned at these exact in- tervals. Since patients do not arrive at regularly spaced intervals, nor do clinicians order CT scans at set times, there will inevitably be times at which the scanner is idle. In light of the other factors that may prevent a patient who has already had a scan ordered from going to the scanner (for instance, awaiting a creatinine result), the CT may sit idle even when there are patients with outstanding orders. As the amount of time to perform a CT scan varies considerably, the number of scans that can practically be performed per hour is likely considerably lower. These effects are predicted by the broader discipline of queueing theory. In systems with a single resource, commonly modeled in queue- ing theory as an M/M/1 queue, wait times begin to increase significantly as a system approaches 70 and 80% utilization (in this case, the ratio of scan orders per hour to scans performed per hour) [13,14]. Wait times then rise exponentially as this ratio comes closer and closer to 100% [15]. However, as variability in the rates of orders and fulfillment times increase, delays begin to grow rapidly at lower and lower levels
of utilization.
Median time points by type of scan.
|
Type of Scan (n) |
Total Time Patient in Room |
Total Time Patient Spent on Table |
Total Scan Time |
|
All Scans (n=102) |
12.08 (9.55 – 17.65) |
8.95 (7.00 – 13.19) |
4.82 (3.47 – 7.76) |
|
Noncontrast (n=44) |
10.01 (7.98 – 13.02) |
6.89 (5.71 – 9.16) |
3.63 (2.33 – 5.56) |
|
Noncontrast Head |
8.10 (7.23 – 11.55) |
5.93 (4.98 – 7.22) |
2.69 (2.03 – 3.37) |
|
(n=18) |
|||
|
Noncontrast Head |
12.22 (9.77 – 13.18) |
8.78 (7.10 – 10.98) |
5.08 (4.58 – 7.98) |
|
and Neck (n=15) |
|||
|
IV Contrast (n=58) |
14.38 (10.33 – 19.63) |
11.07 (8.53 – 16.01) |
5.63 (4.50 – 9.83) |
|
Abdomen and/or |
12.00 (10.06 – 16.20) |
8.98 (8.27 – 11.78) |
4.95 (4.31 – 6.44) |
|
Pelvis (n=29) |
|||
|
CTA Head & Neck |
12.42 (9.99 – 18.47) |
9.25 (8.23 – 16.08) |
5.18 (4.03 – 8.95) |
|
(n=13) |
For the ED CT scanner examined in our study, a threshold between 70 and 80% would correspond to ordering 3 scans per hour (or slightly less). As the demand for the scanner approaches this limit, getting pa- tients through the scanner will become an increasing bottleneck to overall throughput. During the observed times in our study, there were often hours during which the rate of orders surpassed that of scans, meaning that each subsequent order translated directly into a larger queue. This will only be relieved once demand for the scanner de- creases, leading to longstanding delays which will persist until the queue for CT eventually clears. The observation that the queue only cleared between 2AM and 5AM demonstrates that during the late after- noon and early evening when a large queue builds up, many of those scans may not get completed until later in the evening. This can be ex- acerbated if there are high priority scans that join the queue and go ahead of the less urgent ones. This can be a significant issue for both op- erational planning and patient experience.
Understanding the amount of time an ED CT scan spends idle, and the CT scanner’s overall level of utilization throughout the course of a day can help ED administrators to decide if and when additional re- sources are needed to facilitate imaging within the ED. If there are sub- stantial idle times, it is likely that there is a bottleneck elsewhere in the system, such as a lack of Patient transporters, or prolonged turnaround times for tests such as creatinine. Alternatively, administrators may need to encourage strategies which can change the pattern of demand, such as having clinicians order imaging earlier within a patient’s workup, or deferring lower priority scans to an inpatient’s stay. Finally, if the utilization of a scanner remains high throughout the day, it may be a sign that the ED truly needs an additional CT scanner, or to requisition another scanner in the hospital during peak times.
- Limitations
This was a convenience sample based on the availability of a single data collector, and on a single CT scanner within a tertiary care center. Other institutions, with different CT scanners, levels of available trans- port personnel, and protocols might observe significantly different amounts of time per scan and between scans. While efforts were made to observe the CT scanner throughout the day, our measurements occurred primarily in the afternoon and evening, which are periods of significantly higher patient and scan volumes, and it is possible that dur- ing slower times with less demand for the scanner, throughput might be slower. The presence of the observer may have led radiology personnel to change their typical practices, which would affect the overall validity of our data. Additionally, some scans, such as noncontrast head CT scans do not require a radiologist to issue a protocol, which may affect the time from order placement to scan performance for a subset of the cases.
In this observational time-motion study of a single ED CT scanner, we found that the scanner took close to 15.7 minutes per scan, with
more time associated with contrast-enhanced scans, and an overall rate of about 3.2 scans performed per hour. Based on this rate, a queue- ing model suggests that delays for our scanner will grow markedly once demand becomes greater than 3 orders for CT scans per hour. While our findings represent those of a pilot study, the exercise is an important one for all EDs to undertake. Understanding the maximum number of CT scans that an ED can feasibly obtain in an hour, and evaluating the scanner’s utilization ratio over time is the first step in taking a rational, data-driven approach to reduce the impact of prolonged CT wait times.
Declaration of Competing Interest
None
References
- Abujudeh H, Vuong B, Baker SR. Quality and operations of portable X-ray examina- tion procedures in the emergency room: queuing theory at work. Emerg Radiol. 2005;11(5):262-6. https://doi.org/10.1007/s10140-005-0405-4.
- Rogg JG, Huckman R, Lev M, Raja A, Chang Y, White BA. Describing wait time bottle- necks for ED patients undergoing head CT. Am J Emerg Med. 2017;35(10):1510-3. https://doi.org/10.1016/j.ajem.2017.04.059.
- Dang W, Kielar AZ, Fu AY, Chong ST, McInnes MD. Does distance matter? Effect of having a dedicated CT scanner in the emergency department on completion of CT imaging and final patient Disposition times. J Am Coll Radiol. 2015;12(3):277-83. https://doi.org/10.1016/j.jacr.2014.11.003.
- Humphries R, Russell PM, Pennington RJ, Colwell KD. utilizing lean management techniques to improve emergency department radiology CT turnaround times. Ann Emerg Med. 2011;58(45):S248.
- Jain S, Frank G, McCormick K, Wu B, Johnson BA. Impact of physician scorecards on emergency department resource use, quality, and efficiency. Pediatrics. 2015;136 (3):e670-9. https://doi.org/10.1542/peds.2014-2363.
- Kelleher Jr MS, Keller J, Blanchette S, Rolen MF, Bokhari SA. The implementation and impact of a quality improvement program in emergency radiology. J Am Coll Radiol. 2016;13(7):878-80. https://doi.org/10.1016/j.jacr.2015.11.021.
- Rigual D, Rove M, Robison Z, et al. Emergency department CT expediency: A time re- duction by redesign. J Am Coll Radiol. 2016;13(2):178-81. https://doi.org/10.1016/j. jacr.2015.08.006.
- Klein D, Khan V. Utilizing six sigma lean strategies to expedite emergency depart- ment CT scan throughput in a tertiary care facility. J Am Coll Radiol. 2017;14(1): 78-81. https://doi.org/10.1016/j.jacr.2016.06.032.
- Casalino E, Wargon M, Peroziello A, et al. Predictive factors for longer length of stay in an emergency department: a prospective multicentre study evaluating the impact of age, patient’s clinical acuity and complexity, and Care pathways. Emerg Med J. 2014;31(5):361-8. https://doi.org/10.1136/emermed-2012-202155.
- van Lent WA, Deetman JW, Teertstra HJ, Muller SH, Hans EW, van Harten WH. Re- ducing the throughput time of the diagnostic track involving CT scanning with com- puter simulation. Eur J Radiol. 2012;81(11):3131-40. https://doi.org/10.1016/j. ejrad.2012.03.012.
- Ramakrishnan S, Nagarkar K, DeGennaro M, Srihari M, Courtney AK, Emick F. A study of the CT scan area of a healthcare provider. Proceedings of the 2004 Winter Simulation Conference, 2004. 2004 Dec 5. IEEE; 2020. p. 2025-31.
- Lopetegui M, Yen PY, Lai A, Jeffries J, Embi P, Payne P. Time motion studies in healthcare: what are we talking about? J Biomed Inform. 2014;49:292-9. https:// doi.org/10.1016/j.jbi.2014.02.017.
- Lipsky L. M/M/1 Queue. Queueing Theory: A Linear Algebraic Approach. Springer Science & Business Media; 2008 Dec 17.
- Gross D, Shortie JF, Thompson JM, Harris CM. Simple Markovian Queueing Models. Fundamentals of Queueing Theory, 25; 2008 Jul; 49-115.
- Joseph JW. Queuing theory and modeling emergency department resource utiliza- tion. Emerg Med Clin North Am. 2020;38(3):563-72. https://doi.org/10.1016/j. emc.2020.04.006.