Risk scores prognostic implementation in patients with chest pain and nondiagnostic electrocardiograms
Correspondence
- Corresponding author. Tel.: +393397472294; fax: +390558947938.

Correspondence
- Corresponding author. Tel.: +393397472294; fax: +390558947938.
 Article Info
To view the full text, please login as a subscribed user or purchase a subscription. Click here to view the full text on ScienceDirect.

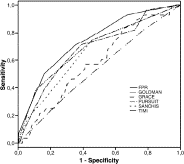
Fig. 1
Areas under the ROC curves of FPR (0.740), Goldman (0.536); Grace (0.589); Pursuit (0.683); Sanchis (0.663); TIMI (0.694); P < .05 vs Goldman and Grace.
Fig. 2
Areas under the ROC curves of the FPR (0.740) and exercise tolerance test (0.733); P = .93.
Fig. 3
Goldman algorithm. Four groups into which patients can be categorized according to risk of major cardiac events within 72 hours after admission.
Fig. 4
Sanchis risk score. Risk categories according to risk score: very low risk, 0 points, primary end point 0%; low risk, 1 point, primary end point 3.1%; intermediate risk, 2 points, primary end point 5.4%; high risk, 3 points, primary end point 17.6%; and very high risk, 4 points, primary end point 29.6%. IDDM indicates insulin-dependent diabetes mellitus; PTCA, percutaneous transluminal coronary angioplasty.
Fig. 5
Florence Prediction Rule. Rate of cardiac events including cardiovascular death, acute myocardial infarction, unstable angina, and revascularization in patients with CP, nondiagnostic ECG, and troponin. Florence Prediction Rule include the following: CP score greater than 6, 1 point; male sex, 1 point; age older than 50 years, 1 point; DM or MS, 1 point. Group A, score 0 to 1, low-risk patients, less than 1% cardiac events; group B, medium-risk, 2 to 4 points, 6% cardiac events; group C, 5 to 6 point, high-risk, 25% cardiac events. DM indicates diabetes mellitus; MS, metabolic syndrome.
Fig. 6
Pursuit score. The 1-month and 1-year end point in the different risk groups for the Pursuit score. The Pursuit score was calculated from the initial clinical history, ECG, and laboratory values collected on admission. Pursuit score less than 10 indicates low-risk patients, MACE 10%.
Fig. 7
TIMI risk score. The 1-month and 1-year end point in the different risk groups for the TIMI score. The TIMI score was calculated from the initial clinical history, ECG, and laboratory values collected on admission. TIMI score less than 3 indicates low-risk patients, MACE 8%.
Fig. 8
Grace score. The 1-month and 1-year end point in the different risk groups for the GRACE score. The Grace score was calculated from the initial clinical history, ECG, and laboratory values collected on admission. Grace score less than 96 indicates low-risk patients, MACE 4%.
Abstract
Background
Several risk scores are available for prognostic purpose in patients presenting with chest pain.
Aim
The aim of this study was to compare Grace, Pursuit, Thrombolysis in Myocardial Infarction (TIMI), Goldman, Sanchis, and Florence Prediction Rule (FPR) to exercise electrocardiogram (ECG), decision making, and outcome in the emergency setting.
Methods
Patients with nondiagnostic ECGs and normal troponins and without history of coronary disease underwent exercise ECG. Patients with positive testing underwent coronary angiography; otherwise, they were discharged.
End point was the composite of coronary stenosis at angiography or cardiovascular death, myocardial infarction, angina, and revascularization at 12-month follow-up.
Results
Of 508 patients considered, 320 had no history of coronary disease: 29 were unable to perform exercise testing, and finally, 291 were enrolled. Areas under the receiver operating characteristic curves for Grace, Pursuit, TIMI, Goldman, Sanchis, and FPR were 0.59, 0.68, 0.69, 0.543, 0.66, and 0.74, respectively (P < .05 FPR vs Goldman and Grace). In patients with negative exercise ECG and overall low risk score, only the FPR effectively succeeded in recognizing those who achieved the end point; in patients with high risk score, the additional presence of carotid stenosis and recurrent angina predicted the end point (odds ratio, 12 and 5, respectively). Overall, logistic regression analysis including exercise ECG, coronary risk factors, and risk scores showed that exercise ECG was an independent predictor of coronary events (P < .001).
Conclusions
The FPR effectively succeeds in ruling out coronary events in patients categorized with overall low risk score. Exercise ECG, nonetheless being an independent predictor of coronary events could be considered questionable in this subset of patients.
To access this article, please choose from the options below
Purchase access to this article
Claim Access
If you are a current subscriber with Society Membership or an Account Number, claim your access now.
Subscribe to this title
Purchase a subscription to gain access to this and all other articles in this journal.
Institutional Access
Visit ScienceDirect to see if you have access via your institution.
Related Articles
Searching for related articles..


