Article, Psychiatry

Association of mental health disorders and Medicaid with ED admissions for ambulatory care-sensitive condition conditions

a b s t r a c t

Introduction: Adult Medicaid enrollees are more likely to have mental health disorders (MHDs) than privately in- sured patients and also have high rates of emergency department (ED) visits for ambulatory care-sensitive con- ditions (ACSCs). We aimed to evaluate the association of MHD and Insurance type with ED admissions for ACSC in the United States.

Methods: We conducted a cross-sectional study of ED visits made by adults aged 18 to 64 years using the corrected 2011 National Emergency Department Survey. Using multivariable logistic regression analysis, we con- trolled for sociodemographics and clinical variables to determine the association between insurance type, MHD, Medicaid, and MHD (as an interaction variable) and ED admissions for ACSC.

Results: There were 131 million ED visits in 2011; after exclusions, 1.4 million admissions were included in our study. Of all ED visits, 44.7% had an MHD, of which 49.9% were covered by Medicaid and 38.1% were covered by private insurance. A total of 32.6% (95% confidence interval, 32.5%-32.7%) of ED admissions were for an ACSC. Medicaid-covered ED visits were more likely to result in ACSC hospital admission (odds ratio, 1.32; 95% confidence interval, 1.30-1.35) compared with visits covered by private insurance. Among patients with MHD, those with Medicaid insurance had 1.6 times the odds of ACSC admission compared with those privately insured. Conclusion: Among all ED admissions, patients covered by Medicaid are more likely to be admitted for an ACSC when compared with those covered by private insurance, with a larger association being present among patients with MHD comorbidities.

(C) 2016

Introduction

Millions of Americans suffer from co-occurring mental and physical chronic illness [1,2]. Adults with mental health disorders (MHDs) are less likely to care for their chronic medical conditions and have worse outcomes of co-occurring chronic diseases compared with patients without MHD [3]. They are also more likely to have frequent visits to the emergency department (ED) and to be admitted [4-7]. States throughout the United States are developing interventions aimed at re- ducing costs by preventing avoidable hospital admissions. Ambulatory care-sensitive condition (ACSC) hospital admissions are a nationally recognized quality measure used to identify avoidable hospital admissions [8].

? Dr Roberta Capp was supported by a Translational NIH K award.

?? C.B., E.J.C., and R.C. have no conflicts of interest.

? This research was presented at the Western SAEM Conference in Tucson, Arizona, on

March 27, 2015, and the National SAEM Conference in San Diego, California, on May 14, 2015.

* Corresponding author at: Department of Emergency Medicine, Denver Health Medical Center, 777 Bannock St, Denver, CO 80204.

E-mail address: [email protected] (C. Bergamo).

Patients insured by Medicaid are more likely to have MHD and to pres- ent to the ED with chronic medical disease complaints [9-11]. Specifically, adult Medicaid enrollees have higher rates of ACSC ED visits compared with those privately insured and uninsured [12]. Survey studies suggest that patients with Medicaid use the ED more often when compared with those who have private insurance because of Primary care access barriers [13]. However, those studies were limited in that they did not (1) evaluate hospital admissions from the ED for ACSC and (2) take into account whether or not Medicaid enrollees had an MHD diagnosis, and how this could potentially impact their care for co-occurring chronic diseases.

Previous studies conducted on the elderly population and veterans showed a strong link between MHD and hospital admissions for ACSC [14,15]. We hypothesize that a similar pattern exists for those with Medicaid insurance. Given the ED is the portal of entry for hospital ad- missions covered by Medicaid insurance, we used a nationally represen- tative all payer ED data set to evaluate whether an interaction exists between MHD and Medicaid insurance coverage when evaluating pa- tients admitted from the ED for an ACSC. Understanding the role of MHD and insurance type on ACSC admissions from the ED has impor- tant clinical and policy implications, especially given that Medicaid is now the largest payer source for low-income Americans.

http://dx.doi.org/10.1016/j.ajem.2016.01.023

0735-6757/(C) 2016

Methods

We conducted a cross-sectional study of adults aged 18 to 64 years using the corrected 2011 National Emergency Department Survey (NEDS). The corrected version accounts for errors found in the prior NEDS 2011 database. We included individuals that were admitted to the hospital from the ED or those that were transferred, as patients that are transferred are usually admitted to the hospital. The NEDS is a part of the Healthcare Cost and Utilization Program, which is the largest US collection of data related to longitudinal hospital care [16]. The data set provides patient level data on a 20% stratified sample of ED visits, from 950 hospitals and 30 states, which are used to generate nationally representative estimates. For the year of 2011, it had approximately 131 million ED visits [17]. Hospitals are selected using a stratified probability sample based on geographic region, trauma designation, urban-rural lo- cation, teaching status, and hospital control in order to provide an accu- rate estimate of the total number of ED visits that occur in the United States. The NEDS is publically available through the Agency for Healthcare Research and Quality.

Primary outcome

Our primary outcome was hospital admissions from the ED for ACSC among patients with MHD and Medicaid when compared with patients with MHD or Medicaid alone.

Study patient population

We defined MHD by applying MHD Clinical Classification Software groupings (650-652, 656-659, 663, and 670) to NEDS diagnostic fields 2 to 15. These numbers correspond to the following MHDs: adjustment disorders, anxiety disorders, attention-deficit, conduct and disruptive behavior disorders, impulse control disorders, Mood disorders, person- ality disorders, schizophrenia and other psychotic disorders, screening and history of Mental health and substance abuse codes, and miscella- neous Mental disorders (eating disorders, mental disorders in pregnan- cy, dissociative disorders, factitious disorders, sleep disorders, and somatoform disorders). We excluded substance abuse and MHDs of in- fancy, given that our goal was to focus on MHDs, including mood, per- sonality, adjustment, anxiety, impulse, and behavioral disorders in the adult population.

ambulatory care-sensitive conditions were defined using the Agen- cy for Healthcare Research and Quality’s definition [8]. The following conditions are included in the analysis: Bacterial pneumonia, hyperten- sion, dehydration, adult asthma, urinary tract infection, chronic- obstructive pulmonary disease, perforated appendix, diabetes short- term complication, diabetes long-term complication, uncontrolled diabetes, lower extremity amputation among patients with diabetes, angina without procedure, and congestive heart failure. We excluded all conditions pertaining to the pediatric population, such as pediatric gastroenteritis, Pediatric asthma, and low birth weight.

From the 131 million ED visits in the NEDS database, we excluded 110 million because they did not lead to a hospital admission. From this population, we excluded patients with a primary admission diagno- sis of MHD because we wanted to evaluate the impact of MHD on ad- missions primarily for ACSC from the ED. We also excluded those who were admitted to the hospital from the ED primarily for an injury be- cause these are more likely a result of trauma and not a chronic disease. Patients who were pregnant or who died in the ED were also excluded. Finally, we excluded those with Medicare insurance because these pa- tients are more likely to be chronically ill and disabled, and not compa- rable with our remaining sample. After all exclusions, we had 1.5 million ED visits in our study, which was equivalent to 6.5 million once weight- ed. We categorized insurance status by Medicaid, private, self-pay, or other. Using the NEDS database, we also collected information on pa- tients’ sex, income, and zip codes.

Statistical analysis

We used descriptive statistics to calculate the mean along with their 95% confidence intervals (CI) for baseline descriptive characteristics. We performed a multivariable logistic regression analysis controlling for sociodemographics and medical comorbidities to determine the as- sociation between insurance type, presence of MHD, and ED admissions for ACSC. In order to determine if MHD modifies the relationship be- tween Medicaid insurance and ED admissions for ACSC, we created an interaction variable (Medicaid * MHD). We report odds ratios (ORs) and 95% CI for variables included in the multivariate logistic regression model. We applied SURVEY commands to account for the complex sur- vey design and provide national estimates. All data analyses were con- ducted in SAS 9.3 (SAS Inc, Cary, NC).

Results

There were 131 million ED visits in the year of 2011. Of these, there were 6.5 million admissions from the ED and, after applying our exclu- sion criteria, 1.4 million admissions were included in our study. The pa- tient characteristics of those individuals, weighted as a total and separated by ACSC vs non-ACSC admission, are listed in Table 1. Individ- uals between the ages of 45 and 64 years made up the majority of ad- missions (29.55% [95% CI, 29.48-29.63] and 31.45% [95% CI, 31.37-

31.53], respectively). Half of the admitted population was female (49.96%; 95% CI, 49.88-50.04). A slightly higher, but statistically signifi- cant, portion of the population with an MHD was admitted for an ACSC (46.04%; 95% CI, 45.89-46.19) compared with a non-ACSC (43.97%; 95% CI, 43.87-44.07).

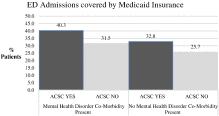
Using an adjusted logistic regression analysis for confounders, there was an interaction between insurance and MHD in association with ad- mission for an ACSC (P b .001; Fig. 1). Medicaid patients without MHD had increased odds of being admitted for an ACSC compared with pa- tients with private insurance and no MHD (OR, 1.33; 95% CI, 1.31- 1.35). Among admissions listing MHD as a comorbidity, those covered by Medicaid were 1.41 times more likely to be for an ACSC compared with privately insured patients.

A total of 32.6% (95% CI, 32.5%-32.7%) of ED admissions were for an ACSC. After controlling for confounding factors, this population was more likely to be 55 to 64 years of age than younger, more likely to be fe- male, more likely to be insured by Medicaid, self-pay or other compared with privately insured, and more likely to have a lower income (Table 2). Certain MHDs were more likely to be associated with admission to the hospital for ACSC than others (Table 3). The presence of an anxiety disorder, mood disorder, or history of an MHD was more closely associ-

ated with admission in relation to other MHDs.

Lastly, lower extremity amputation from a diabetic complication was the leading cause of admission for both individuals with (29.72%) and without an MHD (39.46%) (Appendix 1). Chronic obstructive pul- monary disease (COPD) was the next highest admission for individuals with MHD, with 5.03% of the MHD population admitted for this diagno- sis, whereas only 1.24% of individuals without MHD were admitted for COPD. The remaining admission diagnoses by presence or absence of MHD are presented in Appendix 1.

Discussion

In this national study, we found that although patients with Medicaid have higher rates of ACSC admission when compared with those who are privately insured, even higher rates are seen for those who also have MHD. Our study is novel in that we investigate the interaction between MHD and Medicaid insurance. This interaction suggests that MHD is an important comorbidity to evaluate when assessing avoidable ED use and developing interventions that reduce avoidable hospital admissions. Medicaid enrollees are among those with less socioeconomic re- sources, with complex medical problems, or in many cases, both. Low-

Table 1

Population characteristics

Characteristic Hospital admission total admission

Total admission,

ACSC (W%)

(n = 472 046;

W = 2 104 909)

ACSC, 95% CI

Non-ACSC

(n = 970 376;

W = 4 347 328)

Non-ACSC, 95% CI

(n = 1 442 422;

W = 6 452 237)

95% CI

Age (y)

18-24

4.61

4.55-4.67

9.18

9.12-9.23

7.69

7.64-7.73

25-34

8.26

8.18-8.35

15.70

15.63-15.78

13.28

13.22-13.33

35-44

15.15

15.05-15.26

19.43

19.35-19.51

18.04

17.97-18.10

45-54

31.70

31.56-31.84

28.51

28.42-28.60

29.55

29.48-29.63

55-64

40.27

40.13-40.42

27.18

27.08-27.27

31.45

31.37-31.53

Sex (female)

50.80

50.65-50.94

49.55

49.45-49.66

49.96

49.88-50.04

Insurance

Medicaid

36.26

36.11-36.40

28.25

28.16-28.35

30.86

30.79-30.94

Private

41.68

41.53-41.82

48.44

48.34-48.54

46.23

46.15-46.32

Self-pay

16.67

16.56-16.78

17.99

17.91-18.07

46.23

46.15-46.32

Other

5.40

5.33-5.47

5.31

5.27-5.36

5.34

5.31-5.38

patient location

“Central” counties of metro areas of >= 1 million population

32.97

32.84-33.09

32.69

32.61-32.77

32.78

32.73-32.84

“Fringe” counties of metro areas of >= 1 million population

23.45

23.33-23.56

25.36

25.29-25.44

24.74

24.68-24.79

Counties in metro areas of 250 000-999 999 population

19.63

19.63-19.74

19.33

19.27-19.40

19.43

19.39-19.47

Counties in metro areas of 50 000-249 999 population

8.30

8.22-8.38

7.68

7.63-7.73

7.89

7.85-7.92

Micropolitan counties

9.56

9.49-9.64

9.06

9.01-9.10

9.22

9.19-9.25

Not metropolitan or micropolitan counties

6.10

6.03-6.16

5.87

5.83-5.91

5.94

5.92-5.97

Zip code quartile

0-25th percentile

32.23

32.09-32.36

26.44

26.35-26.52

28.33

28.26-28.40

26th-50th percentile

24.56

24.44-24.69

23.08

22.99-23.16

23.56

23.49-23.63

51st-75th percentile

23.19

23.07-23.31

24.69

24.61-24.78

24.20

24.13-24.27

76th-100th percentile

16.83

16.73-16.94

22.47

22.39-22.55

20.63

20.57-20.6

Missing

3.19

3.14-3.24

3.33

3.29-3.36

3.28

3.25-3.31

MHDa

46.04

45.89-46.19

43.97

43.87-44.07

44.65

44.57-44.73

Comorbid condition

Diabetes

70.82

70.68-70.95

2.47

2.44-2.50

24.77

24.69-24.84

HTN

61.39

61.25-61.53

32.48

32.39-32.58

41.91

41.83-41.99

CAD

22.36

22.34-22.48

11.32

11.25-11.38

14.92

14.86-14.98

COPD

14.96

14.86-15.07

8.28

8.23-8.34

10.46

10.41-10.51

CKD

12.32

12.22-12.42

3.71

3.67-3.75

6.52

6.48-6.56

Cancer

8.13

8.05-8.21

10.72

10.66-10.79

9.88

9.83-9.93

CHF

2.45

2.40-2.49

2.94

2.91-2.97

2.78

2.75-2.81

Abbreviations: CAD, coronary artery disease; CHF, congestive heart failure; CKD, chronic kidney disease; HTN, hypertension; W, weighted total.

a Presence of MHD.

income individuals with chronic health problems have a high likelihood of MHD [18,19]. As such, the interaction of MHD, chronic medical prob- lems, and socioeconomic status would seem to have an intimate and deeply intertwined role. These factors are likely linked with the inability to make or keep a primary care appointment or to navigate the system further to receive mental health help.

Interestingly, the most common ACSC admissions for those with MHD were related to respiratory conditions, specifically asthma and COPD. Studies show a significant relationship between respiratory dis- orders and anxiety and depression [20-22]. The feeling of dyspnea, which is often the chief concern associated with an ED visit for a respi- ratory condition, can invoke a strong feeling of anxiety. This feeling may

ED Admissions covered by Medicaid Insurance

50.0

persist after treatment has been implemented and become a regular part of a patient’s life. Over time, a respiratory condition may decrease quality of life, both from a functional and mental standpoint, and pa- tients may subsequently develop depression. Alternatively, those indi- viduals with existing MHD may also have a more difficult time adhering to outpatient management of Respiratory disorders [23], which may increase their likelihood of presenting to the ED and being admitted for treatment.

Although we cannot explain why the interaction between MHD and Medicaid exists in association with ACSC ED admissions, we believe that improving access to behavioral health and primary care services may be the key to decreasing ACSC hospital admissions from the ED. Because Medicaid enrollees have a difficult time accessing primary care services, adding mental health evaluations in the ED (ie, Patient Health Questionnaire-9) may help to identify those patients at most need of in-

tensive outpatient mental health follow-up. In addition, implementing

45.0

40.0

35.0

30.0

% 25.0

Patients 20.0

15.0

10.0

5.0

0.0

40.3

Fig. 1. Insurance status by presence of MHD and ACSC.

31.5 32.8

25.7

ACSC YES ACSC NO

Mental Health Disorder Co-Morbidity Present

ACSC YES ACSC NO

No Mental Health Disorder Co-Morbidity Present

reform to integrate primary care visits with mental health visits may provide the needed support for these patients to function and help treat their comorbid illnesses in the outpatient setting [24,25]. At the very least, more studies need to be completed to evaluation and under- stand this interaction.

Our study is limited in that it is a retrospective cross-sectional study using hospital Claims data. Because of the nature of the study design, we can only conclude that there is an association, not causation, between Medicaid patients with MHD and subsequent ACSC hospital admission from the ED. In addition, it is possible that because we used claims data, we are underdetecting those with MHD, which could potentially alter our results. On a more fundamental level, we were unable to

Table 2

Odds of admission for an ACSC by patient characteristics

Characteristics OR for ACSC

(n = 215 464;

W = 969 103)

Age (y)

18-24

0.70?

0.69-0.72

25-34

0.60?

0.59-0.61

35-44

0.68?

0.67-0.69

45-54

0.83?

0.81-0.84

55-64

Sex (female)

Reference

1.23?

1.22-1.25

Patient location

“Central” counties of metro areas of

Reference

>= 1 million population

95% CI

evaluate the impact of race and ethnicity, as these variables are not available in NEDS. The data also do not distinguish repeat visits from new visits, so high users of the ED could not be identified. Lastly, we are unable to assess primary care and mental health access for these patients.

As the nation moves forward with assessing ways to decrease health care costs, identifying the patient populations that are more likely to be admitted to the hospital for avoidable medical problems is a key im- provement measure. Using national data, our study highlights the im- portance of accounting for Medicaid and MHD as potential drivers for avoidable hospital admissions. Although previous studies have conclud- ed that barriers to accessing primary care are one explanation for the high ACSC ED visits for Medicaid patients, our study finds that MHD

“Fringe” counties of metro areas of >=

1 million population Counties in metro areas of 250 000-999 999 population Counties in metro areas of

50 000-249 999 population

1.09? 1.07-1.11

0.99 0.98-1.01

1.02 0.99-1.04

is an important alternative or additional explanation for these visits. Helping these patients overcome the barriers that exist to obtaining appropriate primary care and addressing their mental health needs may improve their health as well as decrease costs for health care nationwide.

Micropolitan counties 1.12? 1.10-1.14

Not metropolitan or micropolitan counties 1.19? 1.17-1.22

Zip code quartile

0-25th percentile

Reference

26th-50th percentile

0.90?

0.89-0.91

51st-75th percentile

0.82?

0.80-0.83

Appendix 1. Ambulatory care-sensitive condition (ACSC) admission diagnoses

Insurance typea

76th-100th percentile

0.71?

0.70-0.72

ACSC admission

MHD

MHD,

No MHD

MHD,

Missing

0.86

0.83-0.89

diagnosis

(n = 215 464;

95% CI

(N = 256 582;

95% CI

Medicaid 1.33? 1.31-1.35

Private Reference

Self-pay 1.31? 1.28-1.33

Other 1.12? 1.09-1.16

MHD by insurance typeb

Medicaid 1.22? 1.20-1.24

Private 1.15? 1.13-1.17

W = 969 103)

W = 625 608)

Comorbid condition

Diabetes 91.68?

90.24-93.14

Lower-extremity amputation among patients with diabetes

Chronic obstructive

29.72

5.05

29.59-29.86

4.99-5.11

39.45

1.25

39.30-39.59

1.21-1.28

pulmonary disease

Bacterial pneumonia

4.90

4.84-4.96

4.55

4.49-4.62

Adult asthma

3.49

3.43-3.54

2.68

2.63-2.72

Congestive heart

2.79

2.74-2.84

3.58

3.53-3.64

HTN 1.46? 1.45-1.48

CAD 1.28?

1.26-1.30

Diabetes short-term

2.49

2.44-2.53

2.97

2.93-3.03

2.87-2.96

complication

1.62-1.69

Diabetes long-term

1.60

1.57-1.64

2.55

2.51-2.60

0.69-0.72

complication

0.28-0.30

Urinary tract

1.93

1.89-1.97

3.11

3.05-3.16

infection

COPD 2.91?

CKD 1.66?

Cancer 0.70?

CHF 0.29?

failure

Interaction variable

Medicaid for MHD 1.41?

Self-pay for MHD 1.32?

1.38-1.44

1.25-1.39

Hypertension 1.34 1.31-1.37 1.69 1.65-1.72

Dehydration 0.69 0.67-0.72 0.90 0.88-0.93

Other for MHD 1.04 0.99-1.08

Abbreviations: CAD, coronary artery disease; CHF, congestive heart failure; CKD, chronic kidney disease; HTN, hypertension; W, weighted total.

a Corresponds to OR when no MHD present.

b Patients with comorbid MHD.

* Corresponds to a P value less than .001.

Angina without procedure

Perforated appendix

Uncontrolled diabetes

0.63 0.61-0.66 0.88 0.85-0.90

0.52

0.50-0.54

1.35

1.32-1.39

0.45

0.43-0.47

0.57

0.55-0.59

Table 3

MHD percentage among ACSC admissions

MHD

ACSC %

(n = 215 464;

W = 969 103)

ACSC, 95% CIa

Screening and history of mental health

24.06

23.95-24.17

Mood disorder

11.15

11.06-11.22

Anxiety disorder

5.14

5.19-15.27

Schizophrenia and other

1.41

1.38-1.44

psychotic disorders

suicidal ideation 0.29 0.27-0.30

References

  1. Chapman DP, Perry GS, Strine TW. The vital link between chronic disease and de- pressive disorders. Prev Chronic Dis 2005;2(1):A14.
  2. Mental health and chronic diseases. 2012. CDC National Center for Chronic Disease prevention and Health Promotion: Division of population health Issue Brief No 2.
  3. Parks J, Svendsen D, Singer P, Foti ME. Morbidity and mortality in people with seriousMental illness. Available at:www.nasmhpd.org. National Association of State Mental Health Program Directors (NASMHPD) Medical Directors Council 2006.

    Attention-deficit disorder, conduct

    and disruptive behavior disorder

    0.28 0.26-0.30

    Hakenewerth AM, Tintinalli JE, Waller AE, Ising A, DeSelm T. Emergency department visits by patients with mental health disorders–North Carolina, 2008-2010. Center

    Miscellaneous 0.22 0.21-0.24

    Adjustment disorder 0.21 0.20-0.22

    Personality disorder 0.20 0.19-0.21

    for Disease Control and Prevention. MMWR Morb Mortal Wkly Rep 2013;62(23): 469-72.

    Fogarty CT, Sharma S, Chetty VK, Culpepper L. mental health conditions are associat-

    Disorders usually diagnosed in infancy, childhood, or adolescence

    0.05 0.04-0.05

    ed with increased health care utilization among urban Family Medicine patients. J Am Board Fam Med 2008;21(5):398-407.

    Impulse control disorder, NEC 0.01 0.01-0.02

    a CI for proportions.

    Choi NG, Marti CN, Bruce ML, Chunk ME. Relationship between depressive symptom

    severity and emergency department use among low-income, depressed homebound older adults aged 50 years and older. BMC Psychiatry 2012;12:233.

    McAlpine DD, Mechanic D. Datapoints: payer source for emergency room visits by persons with psychiatric disorders. Psychiatr Serv 2002;53(1):14.

  4. AHRQ quality indicators–guide to prevention quality indicators: hospital admission for ambulatory care sensitive conditions. Rockville, MD: Agency for Healthcare Re- search and Quality; 2001[AHRQ Pub. No. 02-R0203].
  5. Taubman SL, Allen HL, Wright BJ, Baiker K, Finkelstein AN. Medicaid increases emergency-department use: evidence from Oregon’s Health Insurance Experiment. Science 2014;343(6168):263-8.
  6. Pukurdpol P, Wiler JL, Hsia RY, Hsia RY, Ginde AA. Association of Medicare and Med- icaid insurance with increasing primary care-treatable emergency department visits in the United States. Acad Emerg Med 2014;21(10):1135-42.
  7. Thomas MR, Waxmonsky JA, Gabow PA, Flanders-McGinnis G, Socherman R, Rost K. Prevalence of psychiatric disorders and Costs of care among adult enrollees in a Medicaid HMO. Psychiatr Serv 2005;56(11):1394-401.
  8. Hsia RY, Brownell J, Wilson S, Gordon N, Baker LC. Trends in adult emergency de- partment visits in California by insurance status, 2005-2010. JAMA 2013;310(11): 1181-3.
  9. Oster A, Bindman AB. Emergency department visits for ambulatory care sensitive conditions: insights into preventable hospitalizations. Med Care 2003;41(2): 198-207.
  10. Bhattacharya R, Shen C, Sambamoorthi U. Depression and ambulatory care sensitive hospitalizations among Medicare beneficiaries with chronic physical conditions. Gen Hosp Psychiatry 2014;36(5):460-5.
  11. Yoon J, Yano EM, Altman L, Cordasco KM, Stockdale SE, Chow A, et al. Reducing costs of acute care for ambulatory care-sensitive medical conditions: the central roles of comorbid mental illness. Med Care 2012;50(8):705-13.
  12. HCUP NEDS Database Documentation. Healthcare Cost and Utilization Project (HCUP). Rockville, MD: Agency for Healthcare Research and Quality; 2014 [http:// www.hcup-us.ahrq.gov/db/nation/neds/nedsdbdocumentation.jsp].
  13. Healthcare Cost and Utilization Project (HCUP). Rockville, MD: Agency for Healthcare Research and Quality; 2015[http://www.ahrq.gov/research/data/hcup/ index.html].
  14. Thomas J, Jones G, Scarinci I, Scarinci I, Brantley P. A descriptive and compara- tive study of the prevalence of depressive and anxiety disorders in low- income adults with type 2 diabetes and other chronic illnesses. Diabetes Care 2003;26(8):2311-7.
  15. Jones DR, Macias C, Barreira PJ, Fisher WH, Hargreaves WR, Harding CM. Prevalence, severity, and co-occurrence of chronic physical health problems of persons with se- rious mental illness. Psychiatr Serv 2004;55(11):1250-7.
  16. Egede LE. Major depression in individuals with chronic medical disorders: prevalence, correlates and association with health resource utilization, lost productivity and functional disability. Gen Hosp Psychiatry 2007;29(5): 409-16.
  17. Eisner MD, Blanc PD, Yelin EH, Katz PP, Sanchez G, Iribarren C, et al. Influence of anx- iety on health outcomes in COPD. Thorax 2010;65(3):229-34.
  18. Filipowski M, Bozek A, Kozlowska R, Kozlowska R, Czyzewski D, Jarzab J. The influ- ence of hospitalizations due to exacerbations or Spontaneous pneumothoraxes on the quality of life, mental function and symptoms of Depression and anxiety in pa- tients with COPD or asthma. J Asthma 2014;51(3):294-8.
  19. Turan O, Yemez B, Itil O. The effects of anxiety and depression symptoms on treatment adherence in COPD patients. Prim Health Care Res Dev 2014;15(3): 244-51.
  20. Zeiss AM, Karlin BE. Integrating mental health and primary care services in the De- partment of Veterans Affairs health care system. J Clin Psychol Med Settings 2008; 15(1):73-8.
  21. Felker BL, Chaney E, Rubenstein LV, Bonner LM, Yano EM, Parker LE, et al. Developing effective collaboration between primary care and mental health providers. Prim Care Companion J Clin Psychiatry 2006;8(1):12-6.

Leave a Reply

Your email address will not be published. Required fields are marked *