
Stair-related injuries treated in United States emergency departments
a b s t r a c t
Objective: To investigate the characteristics of stair-related injuries among individuals of all ages and estimate na- tional injury frequencies and rates using a representative sample of patients treated in United States emergency departments.
Methods: Data from the National Electronic Injury surveillance System were analyzed for patients treated for stair-related injuries in United States emergency departments from 1990 through 2012.
Results: An estimated 24,760,843 patients were treated in emergency departments for a stair-related injury dur- ing the 23-year study period, averaging 1,076,558 patients annually, or 37.8 injuries per 10,000 United States res- idents. The annual rate of stair-related injuries decreased by 12.6% (p b 0.001) during 1990-1996, followed by an increase of 24.0% (p b 0.001) during 1996-2012. Although the highest injury rates occurred among younger chil- dren and older adults, the majority (67.2%) of emergency department visits for stair-related injuries was by in- dividuals 11-60 years old. Most patients were female (62.4%), who also had a higher injury rate (46.5 vs. 29.1 per 10,000) than males. Sprains and strains (32.3%), soft tissue injuries (23.8%), and fractures (19.3%) were the most common types of injury. The body regions most frequently injured were the lower extremities (42.1%) and head/neck (21.6%). Patients <=10 years old experienced more head/neck injuries. Older adult patients more frequently sustained fractures than younger age groups.
Conclusions: Stairs are a common source of injury among individuals of all ages and the frequency and rate of stair-related injuries are increasing. This underscores the need for increased Prevention efforts, particularly those related to stair design and construction.
(C) 2017
Introduction
Stairs are present inside an estimated 49% of homes in the United States (US), not including single-story dwellings that may require stairs for access [1]. Although frequent exposure to these structures may lead many people to underestimate their potential to be associated with in- jury, such injuries are well-documented in the research literature [2-14]. Most stair-related injuries do not result in serious medical out- comes [2-6,11]; however, it is important to note that fatalities do
Abbreviations: CHI, closed head injury; CI, Confidence interval; CPSC, United States Consumer Product Safety Commission; ED, Emergency department; NEISS, National Electronic Injury Surveillance System; RR, Relative risk; US, United States.
* Corresponding author at: Center for Injury Research and Policy, The Research Institute at Nationwide Children’s Hospital, 700 Children’s Drive, Columbus, OH 43205, United States.
E-mail address: [email protected] (G.A. Smith).
1 Address where work was done: Center for Injury Research and Policy, The Research Institute at Nationwide Children’s Hospital; 700 Children’s Drive; Columbus, OH 43205.
occur [2,8,10,15,16]. Overall, falls are the leading cause of non-fatal inju- ry in the US, and are associated with significant morbidity and mortality among older adults [16,17]. Because stairs are so prevalent in society and are a common location for falls to occur, it is important to study stair-related injuries across all age groups.
Previous studies have documented the frequency and characteristics of stair-related injuries among children [3-6,11-13,18]. There is also existing research describing high rates of stair-related injuries among older adults, as well as the associated morbidity and mortality [2,8,10, 14,19,20]. Numerous studies have examined gait characteristics of dif- ferent age groups and their relationship to relative injury rates [21-31]. In addition to describing injuries, studies have also investigated the costs associated with stair-related injuries [32-35]. It is estimated that non-fatal injury-related direct medical and indirect costs are $92 billion annually in the US [35].
The objective of the current study is to investigate the epidemiolog- ical characteristics of stair-related injuries among all ages using a na- tionally representative sample over a multi-year period. Our study
https://doi.org/10.1016/j.ajem.2017.09.034
0735-6757/(C) 2017
injury characteristics and “>also expands upon prior research on this topic to investigate the mech- anisms of stair-related injuries and examine trends.
Methods
Data source
Data for patients treated in US emergency departments (EDs) for stair-related injuries from January 1, 1990 through December 31, 2012 were obtained through the National Electronic Injury Surveillance Sys- tem (NEISS). The NEISS, developed in 1972 and maintained by the US Consumer Product Safety Commission (CPSC), provides consumer prod- uct-related and sports and recreational activity-related injury data from a stratified probability sample of approximately 100 US hospital EDs that provide 24-h care and have at least six beds [36]. Professional NEISS coders review ED medical charts at each participating hospital and transcribe data into the NEISS database. Data are weighted to pro- vide national estimates of injury.
Case selection criteria
All NEISS cases from 1990 through 2012 that involved stairs or steps (NEISS product code 1842, which excludes pull-down and folding stairs) were obtained. Fatalities were excluded (n = 192), because the NEISS does not capture fatal cases well. Cases involving escalators, lad- ders, or step stools (NEISS codes 0618, 0619, 0620, 0688, 1890, 3262,
4032, 4033, 4077, and 4078) were not included in this study. After ap- plying case selection criteria, there were 650,255 unweighted stair-re- lated injuries included in this study.
Variables
NEISS variables included in study analyses were patient age and gen- der, body region injured, injury diagnosis, disposition from the ED, lo- cale of injury, as well as the brief case narrative describing the incident. Cases were categorized into nine single-decade age groups for investigation of age-related trends. In order to examine injury fre- quencies and rates among younger children and older adults separately, we divided cases into three broader age categories: (1) younger chil- dren (<= 10 years), (2) older children and adults (11-60 years), and (3) older adults (>= 61 years). Body region injured was collapsed into 5 body regions: (1) head/neck, (2) upper extremity (including shoulder),
(3) trunk, (4) lower extremity, and (5) other/not specified. Diagnosis was categorized as: (1) strains/sprains, (2) soft tissue injury (including contusions, abrasions, and hematomas), (3) fractures, (4) lacerations (including lacerations, amputations, and punctures), (5) concussion/ closed head injury (CHI; i.e., internal organ injury to the head region), and (6) other/not specified. Disposition from the ED was regrouped into four categories: (1) examined/treated and released from the ED,
(2) hospitalized (including treated and admitted, transferred for hospi- talization or to another hospital, and held for observation), (3) left against medical advice, and (4) not specified. The location of injury was recoded as (1) home (including home, apartment, condo, and mo- bile home), (2) outside of the home (including school, farm/ranch, street/highway, industrial place, other public property, sports or recrea- tion place), or (3) not specified.
Assisted by a computerized keyword search, information included in
the case narratives was used to categorize mechanism of injury into the following groups: (1) fell on stairs via unspecified mechanism (includ- ing tumbles); (2) slid or slipped on stairs; (3) tripped on the stairs or over an object on the stairs; (4) missed a step or had a misstep (includ- ing stumbles); (5) running or playing (including intentional risky be- haviors, such as riding down the stairs on a toy or sliding down the banister); (6) fell while carrying an object, child, or person, or while being carried; and (7) other. For case narratives describing multiple mechanisms of injury, the first mechanism in a temporal sequence of
mechanisms was chosen. For example, if a person was carrying a basket of clothes down the stairs and then tripped, the case was coded as car- rying an object.
Statistical analysis and ethical statement
Data were analyzed using IBM SPSS 24.0 (Armonk, NY) statistical software. Statistical analyses included piecewise linear regression to evaluate the statistical significance of secular trends, chi-square analy- sis, and Relative risk with a 95% confidence interval (CI). The esti- mated slope from the regression model (m) was reported with the associated p-value. The level of significance was set at ? <= 0.05 for all statistical tests. Injury rates per 10,000 US residents were calculated using data from the US Census Bureau [37-39]. US census data combine all individuals 85 years of age and older into one age group; therefore, injury rates in this study were calculated accordingly. National esti- mates were calculated using NEISS weights provided by the CPSC, and all numbers reported in this study are national estimates unless other- wise identified as unweighted cases. The institutional review board at the authors’ institution determined that this study was exempt.
Theory
This study provides a comprehensive epidemiological analysis of na- tionally representative emergency department data covering a 23-year period regarding an important source of injury morbidity in the US. In addition, within the context of study findings, this article describes rel- evant injury Prevention strategies.
Results
Overall injury characteristics and trends
An estimated 24,760,843 (95% CI: 20,833,284-28,688,402) individ-
uals were treated in US EDs for stair-related injuries from 1990 through 2012, averaging 1,076,558 stair-related injuries per year or an annual rate of 37.8 per 10,000 US residents (Table 1, Fig. 1). The number of in- juries decreased (-5.8%, m = -8391.1, p = 0.065) from 951,550 cases in 1990 to 896,769 cases in 1996, before increasing to 1,296,148 cases in 2012 (44.5%, m = 24,925.0, p b 0.001; Fig. 1). This corresponded to a 12.6% (m = -0.765, p b 0.001) decrease in the rate of stair-related in- juries from 1990 (38.1 per 10,000 population) to 1996 (33.3 per 10,000 population), followed by a 24.0% (m = 0.494, p b 0.001) increase from 1996 to 2012 (41.3 per 10,000 population).
Patients ranged in age from b 1 to 115 years old, with a mean age of
36.7 years (standard error of the mean: 0.53; median: 33.6, interquartile range: 18.4-52.0). Female patients accounted for 62.4% of all stair-relat- ed injuries, and the majority of injuries (61.2%) occurred at home (Table 1). The body regions most commonly injured were the lower extremi- ties (42.1%), head/neck (21.6%), and trunk (18.1%), and the most com- mon diagnoses were strain/sprain (32.3%), soft tissue injury (23.8%), and fracture (19.3%) (Table 1). Lower extremity injuries were most commonly strains/strains (54.1%) and fractures (21.4%), upper extrem- ity injuries were primarily fractures (37.0%) and soft tissue injuries (26.1%), and most trunk injuries were soft tissue injuries (38.9%) and strain/sprains (27.0%). Among head/neck injuries, 34.1% were lacera- tions, 26.6% were concussions/CHIs, and 25.6% were soft tissue injuries. The majority (93.8%) of patients were examined/treated and re- leased from the ED and 5.7% of injuries resulted in hospitalization (Table 1). The rate of hospitalization per 10,000 population decreased by 26.7% (m = 0.11, p b 0.001) from 2.1 in 1990 to 1.6 in 1997, and
then increased by 99.8% (m = 0.10, p b 0.001) from 1997 to 3.1 in 2012. More than one-half of the injuries requiring hospitalization were fractures (59.4%), and an additional 14.2% were concussions/ CHIs. Overall, 59.4% of injured patients fell down the stairs without a
Characteristics of stair-related injuries treated in emergency departments in the United States, NEISS 1990-2012.
|
<= 10 Years |
11-60 Years |
>= 61 Years |
Total |
||
|
Characteristics |
n (%)a |
n (%)a |
n (%)a |
n (%)a |
95% CI |
|
Gender |
|||||
|
Male |
2,045,122 (55.8) |
5,944,214 (35.7) |
1,307,205 (29.4) |
9,298,421 (37.6) |
7,830,577-10,766,264 |
|
Female |
1,621,697 (44.2) |
10,699,857 (64.3) |
3,135,207 (70.6) |
15,458,185 (62.4) |
12,980,928-17,935,441 |
|
Not specified |
963 (0.0)d |
2379 (0.0)d |
825 (0.0)d |
4237 (0.0) |
2782-5693 |
|
Location |
|||||
|
Home |
2,314,410 (63.1) |
10,030,244 (60.3) |
2,802,228 (63.1) |
15,148,717 (61.2) |
12,488,781-17,808,653 |
|
Outside of home |
265,650 (7.2) |
1,207,170 (7.3) |
476,503 (10.7) |
1,949,646 (7.9) |
1,582,908-2,316,383 |
|
Not specified |
1,087,722 (29.7) |
5,409,036 (32.5) |
1,164,507 (26.2) |
7,662,480 (30.9) |
5,785,344-9,539,616 |
|
Body region injured |
|||||
|
Head/neck |
2,378,853 (64.9) |
1,923,723 (11.6) |
1,048,670 (23.6) |
5,352,583 (21.6) |
4,514,492-6,190,675 |
|
Upper extremity |
485,067 (13.2) |
2,721,635 (16.3) |
973,262 (21.9) |
4,180,472 (16.9) |
3,511,195-4,849,750 |
|
Trunk |
153,498 (4.2) |
3,346,060 (20.1) |
985,320 (22.2) |
4,485,325 (18.1) |
3,693,102-5,277,547 |
|
Lower extremity |
591,894 (16.1) |
8,479,979 (50.9) |
1,360,134 (30.6) |
10,432,942 (42.1) |
8,781,979-12,083,904 |
|
Other/not specified |
58,470 (1.6) |
175,053 (1.1) |
75,852 (1.7) |
309,521 (1.3) |
247,989-371,052 |
|
Diagnosis Strain/sprain |
315,543 (8.6) |
6,954,985 (41.8) |
725,972 (16.3) |
7,997,359 (32.3) |
6,739,142-9,255,575 |
|
Soft tissue injury |
1,103,732 (30.1) |
3,804,547 (22.9) |
989,986 (22.3) |
5,899,004 (23.8) |
4,965,183-6,832,826 |
|
Fracture |
418,362 (11.4) |
2,823,023 (17.0) |
1,541,789 (34.7) |
4,783,595 (19.3) |
4,003,639-5,563,551 |
|
Laceration |
980,330 (26.7) |
916,706 (5.5) |
502,784 (11.3) |
2,400,287 (9.7) |
2,059,532-2,741,043 |
|
Concussion/closed head injury |
586,751 (16.0) |
520,643 (3.1) |
317,745 (7.2) |
1,425,544 (5.8) |
1,127,873-1,723,214 |
|
Other/not specified |
263,065 (7.2) |
1,626,546 (9.8) |
364,962 (8.2) |
2,255,054 (9.1) |
1,652,073-2,858,034 |
|
Disposition from ED Examined/treated and released |
3,554,321 (96.9) |
16,040,455 (96.4) |
3,623,307 (81.5) |
23,220,642 (93.8) |
19,507,360-26,933,924 |
|
Hospitalized |
93,137 (2.5) |
504,996 (3.0) |
809,587 (18.2) |
1,408,425 (5.7) |
1,172,420-1,644,430 |
|
Left against medical advice |
17,517 (0.5) |
91,705 (0.6) |
8711 (0.2) |
118,026 (0.5) |
81,015-155,036 |
|
Not specified |
2806 (0.1) |
9295 (0.1) |
1632 (0.0)d |
13,750 (0.1) |
7688-19,811 |
|
Mechanism of injury Fell on stairs |
2,488,611 (67.9) |
9,577,715 (57.5) |
2,635,352 (59.3) |
14,704,073 (59.4) |
12,359,884-17,048,262 |
|
Slid/slipped |
164,802 (4.5) |
1,888,179 (11.3) |
414,198 (9.3) |
2,467,354 (10.0) |
1,981,025-2,953,683 |
|
Tripped on stairs/over object |
213,910 (5.8) |
1,341,719 (8.1) |
535,431 (12.1) |
2,091,351 (8.4) |
1,705,564-2,477,137 |
|
Missed step/misstep |
27,913 (0.8) |
768,906 (4.6) |
402,227 (9.1) |
1,199,258 (4.8) |
979,486-1,419,030 |
|
Running/playing |
381,364 (10.4) |
278,523 (1.7) |
12,809 (0.3) |
672,702 (2.7) |
568,211-777,194 |
|
Carrying object/child/person |
69,730 (1.9) |
336,315 (2.0) |
58,425 (1.3) |
464,584 (1.9) |
372,269-556,899 |
|
Other |
321,452 (8.8) |
2,455,092 (14.7) |
384,795 (8.7) |
3,161,520 (12.8) |
2,658,643-3,664,397 |
|
Study total (row %)b,c |
3,667,782 (14.8) |
16,646,451 (67.2) |
4,443,238 (17.9) |
24,760,843 (100.0) |
20,833,284-28,688,402 |
a Column percentages may not sum to 100.0% due to rounding error.
b Row percentages may not sum to 100.0% due to rounding error.
c Age not specified for 3372 injured patients.
d Estimate is potentially unstable due to sample size b20 cases, estimate b1200 cases, or coefficient of variation N 30.0%.
specified mechanism of injury and a combined 23.2% slid/slipped, tripped, or misstepped (Table 1).
Injuries by patient age and gender
The stair-related injury rate was tri-modal with peaks among chil- dren <= 3 years of age, young adults in their 20's, and adults >= 85 years old with the highest rates at the extremes of the age spectrum (Fig. 2). The overall injury rate was higher for females (46.5 per 10,000 female population) than males (29.1 per 10,000 male population); this was true across all age-groups except <= 10 year-olds (Fig. 3). When examin- ing single-decade age groups, starting in the second decade the propor- tion of injuries sustained by females, compared with males, increased with age (Fig. 3).
Although more than two-thirds of injuries occurred among older children and adults 11-60 years old (67.2%), the injury rate per 10,000 population was highest (42.2) among older adults >= 61 years old com- pared with 37.2 for older children and adults 11-60 years old and 36.8 for younger children <= 10 years old. Among younger children, the injury rate per 10,000 children <= 10 years decreased by 31.8% (m = -1.12, p b 0.001) from 45.5 in 1990 to 31.7 in 2005, followed by an 8.6% (m = 0.54, p = 0.009) increase from 2005 to 33.7 in 2012 (Fig. 4). For older chil- dren and adults, the injury rate per 10,000 individuals decreased by 15.1% (m = - 0.64, p = 0.002) from 36.0 in 1990 to 30.6 in 1996,
followed by a 36.5% (m = 0.69, p b 0.001) increase from 1996 to 41.7 in 2012. The injury rate per 10,000 older adults >= 61 years old declined by 4.6% (m = - 0.12, p = 0.641) from 39.5 in 1990 to 38.7 in 1995,
and then increased by 20.3% (m = 0.47, p b 0.001) from 1995 to 46.7
in 2012 (Fig. 4).
Males accounted for more than half (55.8%) of injuries among youn- ger children compared with 35.7% among older children and adults and 29.4% among older adults (Table 1). Patients <= 10 years old were 5.61 times (95% CI: 5.38-5.86) more likely to have injuries to the head/ neck (64.9% of all injuries) than patients 11-60 years old (11.6%) and
2.75 times (95% CI: 2.65-2.85) more likely than patients >= 61 years old (23.6%) (Table 1). Head/neck injuries among children <= 10 years old were most commonly lacerations (38.1%), soft tissue injuries (31.3%), and concussions/CHIs (24.7%).
The most commonly injured body region among older children and adults and older adults was the lower extremity (50.9% and 30.6% of in- juries, respectively). The most common diagnoses by age group were Soft tissues injury among younger children (30.1%), strains/sprains among older children and adults (41.8%), and fractures among older adults (34.7%). Patients >= 61 years old were 3.04 times (95% CI: 2.89- 3.21) more likely than patients <= 10 years old and 2.05 times (95% CI: 1.96-2.13) more likely than patients 11-60 years old to sustain a fracture.
In each age group, the majority of injures were examined/treated and released. However, patients >= 61 years old were 7.18 times (95% CI: 6.39-8.06) more likely than patients <= 10 years old and 6.01 times (95% CI: 5.56-6.49) more likely than patients 11-60 years old to be hospitalized. The most common type of injury among older adults requiring hospitalization was a fracture (65.9%). Overall, the most common mechanism of injury among all three age groups was falling
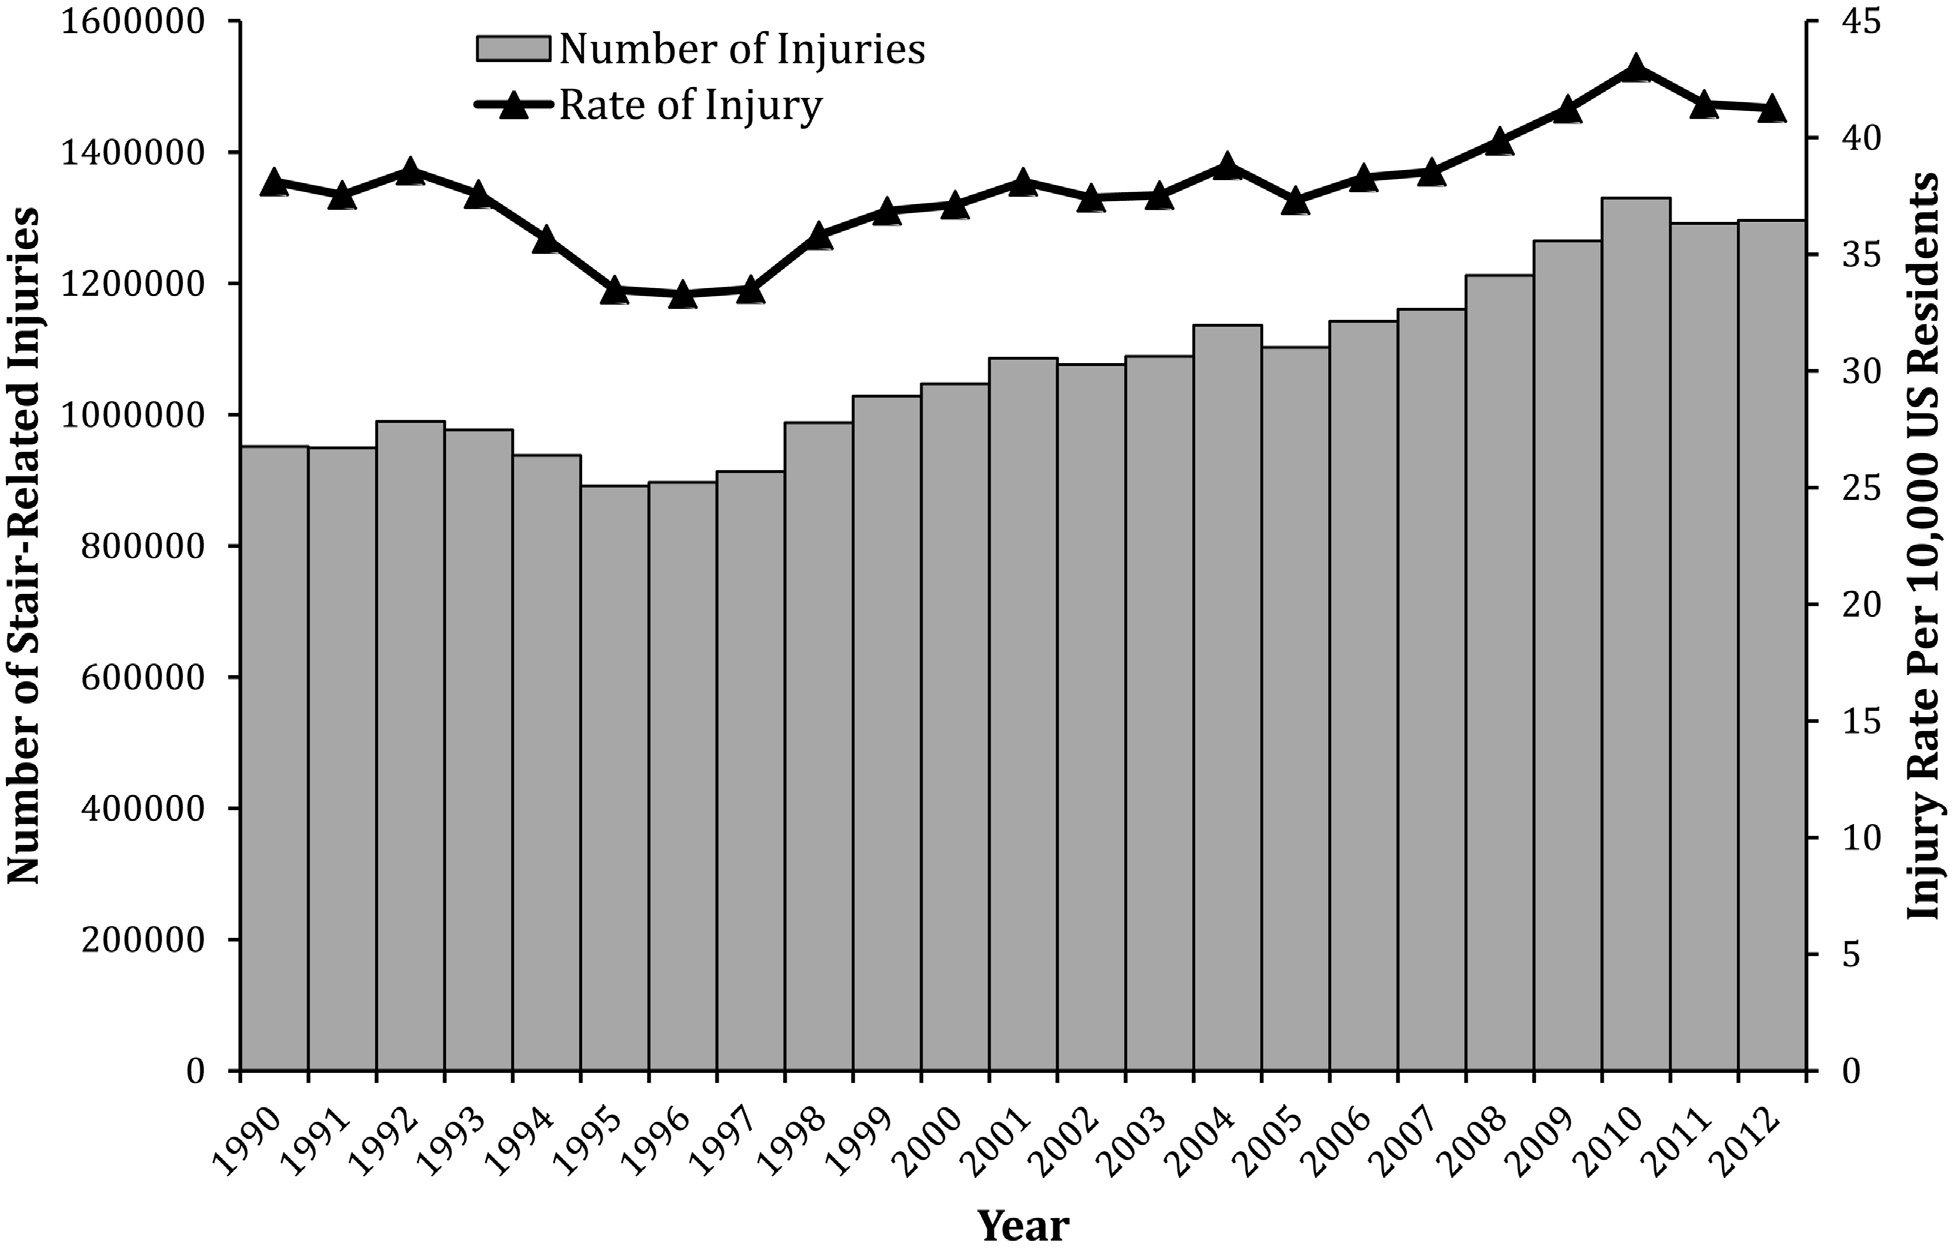
Fig. 1. Estimated number and rate of stair-related injuries by year, NEISS 1990-2012.
down the stairs without a specified mechanism (Table 1). However, the proportion of injuries related to slips/trips/missteps increased with age (younger children: 11.1%; older children and adults: 24.0%; older adults: 30.4%). Among younger children, 10.4% of injuries were related to running/playing on the stairs; of these, 50.4% were to the head/neck region.
Discussion
There were an average of 1,076,558 stair-related injuries per year during the study period, equaling an average of 2949 injuries daily, and the number and rate of injuries are increasing. The observed 24% in- crease in the rate of stair-related injuries from 1996 to 2012 was
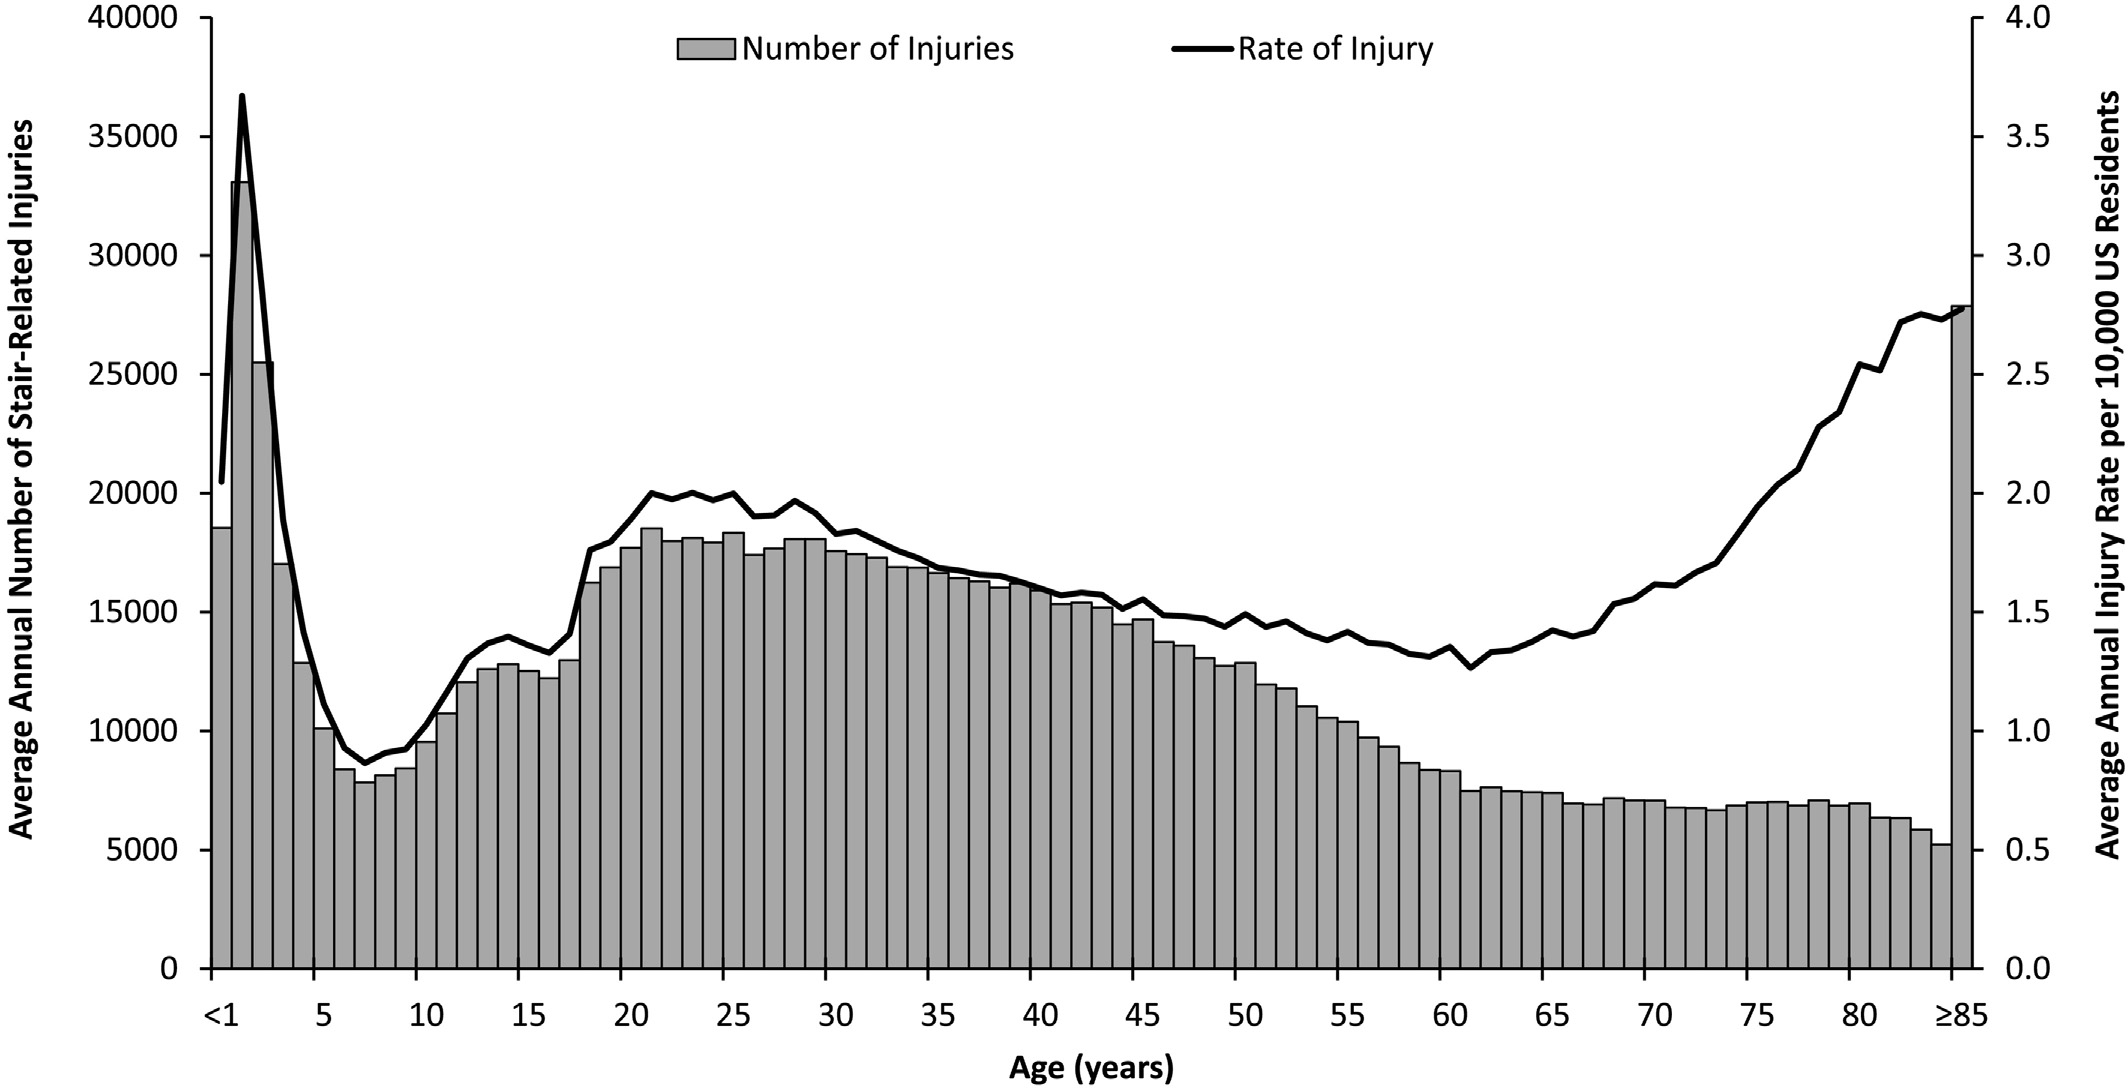
Fig. 2. Estimated average annual number and rate of stair-related injuries by age, NEISS 1990-2012.
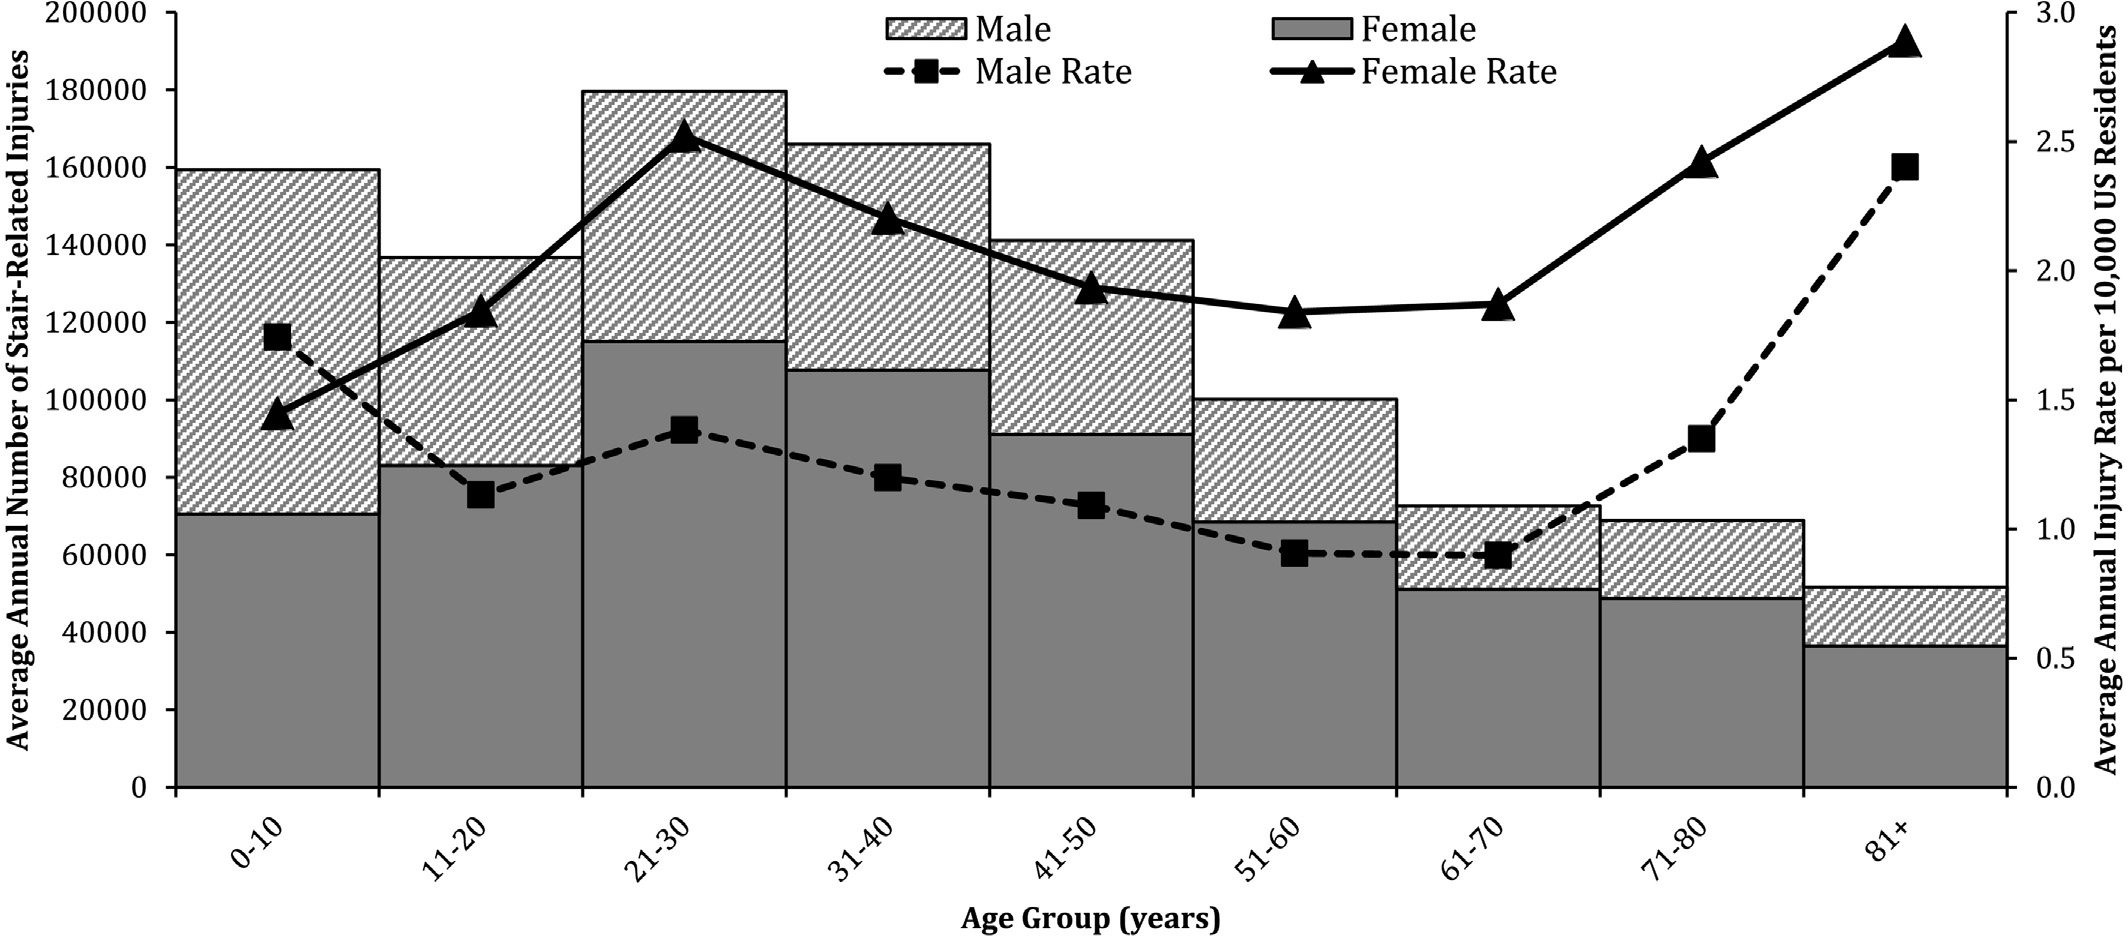
Fig. 3. Estimated average annual number and rate of stair-related injuries by age group and gender, NEISS 1990-2012.
primarily attributable to the 36% increase in the rate among older chil- dren and adults 11-60 years of age during 1996 to 2012 and the 20% in- crease among older adults >= 61 years of age during 1995 to 2012. The 32% decline in the rate of stair-related injuries among younger children observed from 1990 to 2005 was likely influenced by a 76% decrease in the number of infant walker-related injuries from 1990 to 2001 that was associated with introduction of stationary activity centers as an al- ternative to mobile infant walkers in 1994 and strengthening of the ASTM International F977 infant walker voluntary safety standard in 1997 [40]. Consistent with prior studies, most injuries among children were lacerations or soft tissue injuries, most frequently to the head or neck, and rarely required hospitalization [2-6,11,12]. Among older adults, injuries tended to be more severe, often included fractures, and had higher rates of hospital admission [2,8,19,20].
Although the injury rate was highest among older adults in this study, individuals 11-60 years of age accounted for more than two-
thirds of all stair-related injuries and had the second highest injury rate. Prior studies have identified the high injury rates at either end of the life spectrum, but have not emphasized this middle age group. The middle group in the tri-modal age distribution in Fig. 2 has been largely ignored. Because women account for the majority of stair-related inju- ries, including in this middle age group, a new target population for pre- vention should be women, starting in their 20’s. This study was unable to identify the reasons for the higher injury rates among these women due to the limited information contained in the NEISS case narratives. However, these are the child-bearing and parenting years and N 60% of injuries occurred in the home; therefore, a possible contributing factor could include increased exposure to stairs related to greater time in the home while caring for children and performing household chores. Prior research also has documented high rates of falls among women during pregnancy [41]. In addition, women’s footwear is different from that of men and may be a factor while navigating stairs.
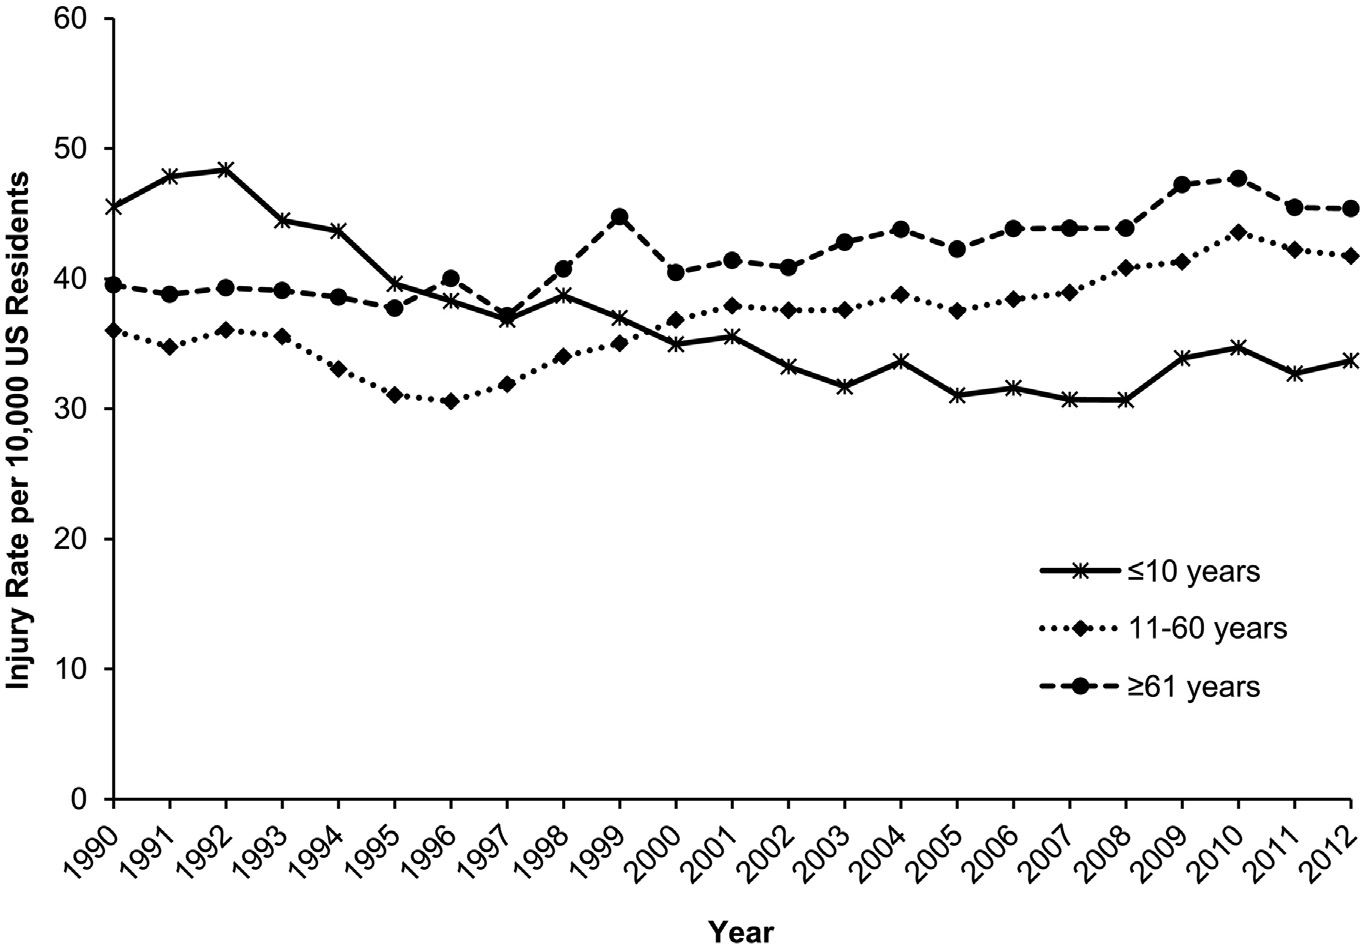
Fig. 4. Estimated annual rate of stair-related injuries by age group, NEISS 1990-2012.
Given that the number and rate of stair-related injuries is increasing in the US since 1996, especially among older children and adults 11- 60 years of age and older adults >= 61 years of age, additional safeguards and prevention efforts should be employed. In construction and remod- eling of all stairways, careful consideration should be given to utilizing safe and user-friendly stair geometries. For example, increasing the length of the “goings,” or the horizontal surfaces on which your foot rests between the lead edges of each stair, and ensuring that all goings and rises (the vertical distances between two treads or a tread and a landing) are uniform [42,43]. Uniformity among all steps can help pre- vent missteps that result from a step not being where the user antici- pates it will be [42]. A missing nosing from the top step is a common first step defect. Stair patterns and geometries should be maintained all the way down to the last step, so as to avoid a bottom-of-stair illusion that may cause an individual to miss the last step [44]. In addition, installing handrails that allow for a power-grip, in which the entire hand can surround the rail, rather than just a pinch grip, can help to en- hance user stability and prevent falls [45-47]. Stairs and railings should be well-maintained and free of excess polishes that could make surfaces slippery [42]. Loose carpeting on stairs should be repaired. Given that stair design and construction are likely to have the biggest influence on preventing stair injuries [42], policy makers should consider revising building codes to require that stairs comply with best practice safety recommendations.
Aside from structural improvements, behavioral changes can also be implemented to reduce the risk of stair-related injuries. Stairs and sur- rounding areas should be well-lit and kept clear of any objects that could present a slip or trip hazard. Individuals should limit multi- tasking while navigating the stairs and use caution when carrying chil- dren or large, heavy, or bulky items, or items that may obscure one’s vi- sion, such as laundry baskets [13]. Pets may also pose a trip hazard. Individuals should maintain contact with the stair railing at all times, so that if one begins to fall, stability can be regained more easily. Chil- dren should be discouraged from running, jumping, or playing on stairs [11]. Individuals may also wish to consider the footwear they wear while walking on stairs.
Study limitations
This study has several limitations. Because this study only included patients treated in hospital EDs, it underestimates the total number of stair-related injuries in the US. Injuries that are treated in other healthcare settings, or that are untreated, are not captured in the NEISS. In addition, the NEISS underestimates fatalities because it does not capture fatalities that are not transported to the ED or deaths that occur after patients are admitted to the hospital, and for that reason, fa- talities were excluded from this study. NEISS case narratives are manu- ally transcribed by individual coders, and thus, may be inconsistent or lack complete details about the circumstances surrounding the injury. Additionally, there may be incomplete documentation in the ED medi- cal record by medical personnel, resulting in missing information. De- spite these limitations, a strength of this study is that a large, nationally-representative sample was used to characterize stair-related injuries among patients of all ages over a 23-year study period.
Conclusions
This study demonstrates that stair-related injuries are an important common cause of injury among individuals of all ages. The number and rate of stair-related injuries treated in US EDs are increasing, indicating a need for more effective prevention efforts. Notably, a large proportion of the injury burden occurs to the adult female population. Although the causes for this finding are uncertain, it is an important factor to consider when developing targeted interventions for this injury problem. Pre- vention strategies include revising building codes and updating existing stairways to comply with geometric dimensions recommended for
optimal safety, ensuring uniformity of all stairs in a stairway, and instal- lation of stair rails that allow for use of a power grip. Individuals can help prevent injuries by keeping stairways clear of clutter and trip hazards, ensuring that stairways are well-lit, and reducing multi-tasking while navigating the stairs.
Funding source
Author Danielle Herbert Blazewick received a research scholarship stipend from the National Student Injury Research Training Program at Nationwide Children’s Hospital, funded by the National Center for In- jury Prevention and Control, Centers for Disease Control and Prevention (grant #1R49CE002106) and Child Injury Prevention Alliance, while she worked on this study. The interpretations and conclusions in this article do not necessarily represent those of the funding organizations.
Financial disclosure statement
The authors have nothing to disclose relevant to this study.
Conflict of interest statement
The authors have no conflicts of interest relevant to this study.
References
- US Census Bureau. American Housing Survey. https://www.census.gov/programs- surveys/ahs/data.html; 2015, Accessed date: 21 August 2017.
- Boele van Hensbroek P, Mulder S, Luitse JS, van Ooijen MR, Goslings JC. Staircase falls: high-risk groups and injury characteristics in 464 patients. Injury 2009; 40(8):884-9.
- Chiaviello CT, Christoph RA, Bond GR. Stairway-related injuries in children. Pediat- rics 1994;94(5):679-81.
- Docherty E, Hassan A, Burke D. Things that go bump … bump … bump: an analysis of injuries from falling down stairs in children based at Sheffield Children’s Hospital. Emerg Med J 2010;27(3):207-8.
- Ibrahim NG, Wood J, Margulies SS, Christian CW. Influence of age and fall type on head injuries in infants and toddlers. Int J Dev Neurosci 2012;30(3):201-6.
- Joffe M, Ludwig S. Stairway injuries in children. Pediatrics 1988;82(3 Pt 2):457-61.
- Pierce MC, Bertocci GE, Janosky JE, Aguel F, Deemer E, Moreland M, et al. Femur frac- tures resulting from stair falls among children: an injury plausibility model. Pediat- rics 2005;115(6):1712-22.
- Ragg M, Hwang S, Steinhart B. Analysis of Serious injuries caused by stairway falls. Emerg Med 2000;12(1):45-9.
- Svanstrom L. Falls on stairs: an epidemiological accident study. Scand J Soc Med 1974;2(3):113-20.
- Wyatt JP, Beard D, Busuttil A. Fatal falls down stairs. Injury 1999;30(1):31-4.
- Zielinski AE, Rochette LM, Smith GA. Stair-related injuries to young children treated in US emergency departments, 1999-2008. Pediatrics 2012;129(4):721-7.
- Kendrick D, Zou K, Ablewhite J, Watson M, Coupland C, Kay B, et al. Risk and protec- tive factors for falls on stairs in young children: multicentre case-control study. Arch Dis Child 2016;101(10):909-16.
- Pennock AT, Gantsoudes GD, Forbes JL, Asaro AM, Mubarak SJ. Stair falls: caregiver’s “missed step” as a source of childhood fractures. J Child Orthop 2014;8(1):77-81.
- Kim SH. Risk factors for severe injury following indoor and outdoor falls in geriatric patients. Arch Gerontol Geriatr 2016;62:75-82.
- Cayless SM. Slip, trip and fall accidents: relationship to building features and use of coroners’ reports in ascribing cause. Appl Ergon 2001;32(2):155-62.
- Centers for Disease Control and Prevention. Web-based Injury Statistics Query and Reporting System (WISQARS). https://www.cdc.gov/injury/wisqars/index.html; 2015, Accessed date: 21 June 2017.
- Bergen G, Stevens MR, Burns ER. Falls and fall injuries among adults aged >=65 years - United States, 2014. MMWR Morb Mortal Wkly Rep 2016;65(37):993-8.
- Pomerantz WJ, Gittelman MA, Hornung R, Husseinzadeh H. Falls in children birth to 5 years: different mechanisms lead to different injuries. J Trauma Acute Care Surg 2012;73(4 Suppl 3):S254-7.
- Schiller JS, Kramarow EA, Dey AN. Fall injury episodes among noninstitutionalized older adults: United States. Adv Data 2001-2003;2007(392):1-16.
- Rubenstein LZ. Falls in older people: epidemiology, risk factors and strategies for prevention. Age Ageing 2006(35 Suppl 2):ii37-41.
- Begg RK, Sparrow WA. Gait characteristics of young and older individuals negotiat- ing a raised surface: implications for the prevention of falls. J Gerontol A Biol Sci Med Sci 2000;55(3):M147-54.
- Bosse I, Oberlander KD, Savelberg HH, Meijer K, Bruggemann GP, Karamanidis K. Dy- namic stability control in younger and older adults during stair descent. Hum Mov Sci 2012;31(6):1560-70.
- Chen HC, Ashtonmiller JA, Alexander NB, Schultz AB. age effects on strategies used to avoid obstacles. Gait Posture 1994;2(3):139-46.
- Chen HC, Ashton-Miller JA, Alexander NB, Schultz AB. Stepping over obstacles: gait patterns of healthy young and old adults. J Gerontol 1991;46(6):M196-203.
- Christina KA, Cavanagh PR. Ground reaction forces and frictional demands during stair descent: effects of age and illumination. Gait Posture 2002;15(2):153-8.
- Cohen HH. A field study of stair descent. Ergonomics in Design 2000;8(2):11-5.
- Hamel KA, Cavanagh PR. Stair performance in people aged 75 and older. J Am Geriatr
Hamel KA, Okita N, Higginson JS, Cavanagh PR. Foot clearance during stair descent: effects of age and illumination. Gait Posture 2005;21(2):135-40.
- Herman T, Inbar-Borovsky N, Brozgol M, Giladi N, Hausdorff JM. The dynamic gait index in healthy older adults: the role of stair climbing, fear of falling and gender. Gait Posture 2009;29(2):237-41.
- Lythgo N, Begg R, Best R. Stepping responses made by elderly and young female adults to approach and accommodate known surface height changes. Gait Posture 2007;26(1):82-9.
- Wang K, Delbaere K, Brodie M, Lovell N, Kark L, Lord S, et al. Differences between gait on stairs and flat surfaces in relation to fall risk and future falls. IEEE J Biomed Health Inform 2017.
- Ellis AA, Trent RB. Do the risks and consequences of hospitalized fall injuries among older adults in California vary by type of fall? J Gerontol A Biol Sci Med Sci 2001; 56(11):M686-92.
- Pauls JL. Review of stair-safety research with an emphasis on Canadian studies. Ergo-
Roudsari BS, Ebel BE, Corso PS, Molinari NA, Koepsell TD. The acute medical care costs of fall-related injuries among the U.S. older adults. Injury 2005;36(11): 1316-22.
- Lawrence BA, Spicer RS, Miller TR. A fresh look at the costs of non-fatal consumer product injuries. Inj Prev 2015;21(1):23-9.
- US Consumer Product Safety Commission. National Electronic Injury Surveillance System: a tool for researchers. https://www.cpsc.gov/s3fs-public/pdfs/blk_media_ 2000d015.pdf; 2000, Accessed date: 27 June 2017.
- US Census Bureau. National Intercensal Tables: Intercensal estimates of the United States resident population by age and sex. https://www.census.gov/data/tables/ time-series/demo/popest/intercensal-national.html; 1990-2000, Accessed date: 17
March 1930.
US Census Bureau. Annual estimates of the resident population by single year of age and sex for the United States: April 1, 2010-July 1, 2012. https://factfinder.census. gov/faces/tableservices/jsf/pages/productview.xhtml?src=bkmk, Accessed date: 17 March 1930.
- US Census Bureau. National Intercensal Tables: 2000-2010 intercensal estimates by sex and age. https://www.census.gov/data/tables/time-series/demo/popest/ intercensal-2000-2010-national.html, Accessed date: 17 March 1930.
- Shields BJ, Smith GA. Success in the prevention of infant walker-related injuries: an analysis of national data, 1990-2001. Pediatrics 2006;117(3):e452-.
- Dunning K, Lemasters G, Bhattacharya A. A major public health issue: the high inci- dence of falls during pregnancy. Matern Child Health J 2010;14(5):720-5.
- Roys MS. Serious stair injuries can be prevented by improved stair design. Appl Ergon 2001;32(2):135-9.
- Novak AC, Komisar V, Maki BE, Fernie GR. Age-related differences in dynamic bal- ance control during stair descent and effect of varying step geometry. Appl Ergon 2016;52:275-84.
- Johnson D. Stair safety: bottom of flight illusion. Work 2012;41(Suppl. 1):3358-62.
- Pauls JL. Are functional handrails within our grasp? Building Standards 1991;60(1):
Dusenberry DO, Simpson H, Dellorusso SJ. Effect of handrail shape on graspability. Appl Ergon 2009;40(4):657-69.
- Maki BE, Perry SD, McIlroy WE. Efficacy of handrails in preventing stairway falls: a new experimental approach. Safety Science 1998;28(3):189-206.