Article, Emergency Medicine

Sick and unsheltered: Homelessness as a major risk factor for emergency care utilization

a b s t r a c t

Objective: Homelessness is a critical public health issue and socioeconomic epidemic associated with a dispropor- tionate burden of disease and significant decrease in life expectancy. We compared emergency care utilization between individuals with documented homelessness to those enrolled in Medicaid without documented home- lessness.

Methods: 
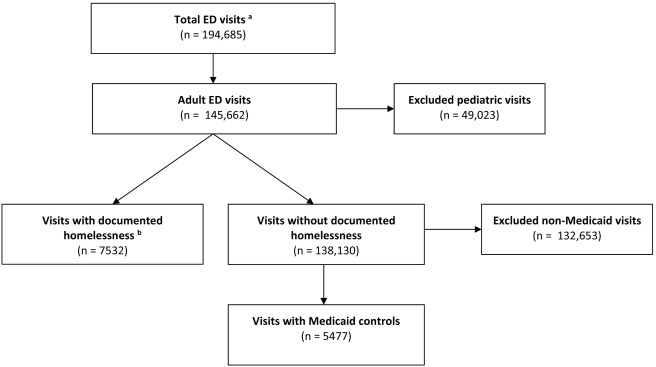
We conducted a retrospective cohort study consisting of electronic medical record review of demo- graphics, chief complaints, and health care utilization metrics of adults with homelessness compared to a group enrolled in Medicaid without identified homelessness. The chart review spanned two years of emergency visits at a single urban, academic, tertiary care medical center. Descriptive statistics, bivariate and multivariate analyses were utilized.

Results: Over the study period, 986 patients experiencing homelessness accounted for 7532 ED visits, with a mean of 7.6 (SD 19.9) and max of 316 visits. The control group of 3482 Medicaid patients had 5477 ED visits, with a mean of 1.6 visits (SD 2.1) and max of 49 visits. When controlling for age, sex, race, ethnicity, and ESI, those living with homelessness were 7.65 times more likely to return to the ED within 30 days of their previous visit, 9.97 times more likely to return within 6 months, 10.63 times more likely to return within one year, and 11 times more likely to return within 2 years.

Conclusions: Compared to non-homeless Medicaid patients, patients with documented homelessness were over seven times more likely to return to the ED within 30 days and over eleven times more likely to return to the ED in two years.

(C) 2018

Introduction

Homelessness is a socioeconomic epidemic and a critical public health issue. In the United States, over three million citizens experience homelessness annually, and over 500,000 citizens are homeless on a given night [1]. People experiencing chronic homelessness suffer a mas- sively disproportionate burden of disease, injury, Mental illness and substance abuse [2-14]. Homelessness increases all-cause mortality and decreases life expectancy by up to 30 years, with the average age of death for homeless individuals between 42 and 52 years [2-14]. In ad- dition to high morbidity and mortality, homelessness is associated with substantially higher health care utilization [2-4].

Homelessness is an independent risk factor for ED utilization [7, 15]. Compared to those living in stable accommodations, the homeless are more likely to visit an ED within five years and return to the ED within

* Corresponding author.

E-mail address: [email protected] (D. Adler).

a month of their initial visit [15, 16]. ED discharge to the streets or a shel- ter is associated with a significant increased risk for readmission [17]. The Economic burden is substantial, and the cost of hospitalization and emergency department utilization for the homeless have been re- ported to be up to 3.8 times that of an average Medicaid recipient [3].

Increased utilization of emergency and acute care services for the homeless is multifactorial and has been found to be due to dispropor- tionate burden of disease [3, 6, 15-19], high rates of unintentional inju- ries and traumatic injuries from assault [9-11], psychiatric illness and substance abuse [5, 6, 19-23], food insecurity [24-26], and poor access to primary and preventative care [18]. This increased ED utilization strains health care systems and may serve as a marker for inadequate access to ancillary services, and primary, specialty and preventative care [6, 8].

Research on interventions to improve health of individuals who are homeless has received substantial attention globally, specifically on poverty reduction, housing, and strategies to address social determi- nants of health [27-33]. To most effectively target these interventions, accurate descriptions of healthcare service utilization is needed.

https://doi.org/10.1016/j.ajem.2018.06.001

0735-6757/(C) 2018

The primary objective of this study was to compare emergency de- partment utilization of patients with documented homelessness to non-homeless individuals enrolled in Medicaid. The Medicaid group al- lows us to better control for the effects of low socioeconomic status on ED utilization. Previous work assessing ED utilization among Homeless populations have been done without a control group [3-6, 34], or com- pared to the general population [35]. This makes it challenging to assess the effect of homelessness on healthcare utilization, as socioeconomic status is a major confounding factor.

Methods

We conducted a retrospective cohort study based on a medical chart review that describes characteristics, burden of disease, and health care utilization of homeless adults compared to a group enrolled in Medicaid not identified in the chart review as homeless. The retrospective chart review took place at a single urban, academic, tertiary care center over a two year time period – from January 1, 2013 to December 31, 2014. In- stitutional ethics approval was obtained through a Research Subjects Review Board. The retrospective chart review utilized the medical center’s electronic medical record (EMR).

Inclusion criteria were designed to identify those individuals who were homeless at the time of their interaction with the ED. To be in- cluded in the homeless group, patients had address fields that contained: an address of “homeless,” emergency shelter, hospital, place of worship, or keyword indicating homelessness [36]. We also screened for ICD-9 code v50, and used keyword searches for “homeless” or “homelessness” in chief complaint, clinician notes, social work notes, and discharge summaries. This data was abstracted by computer algo- rithm utilizing regular expressions. All patients that had one or more of the above elements describing homelessness during the study period were included in the study group. The comparison group had to be en- rolled in Medicaid and not identified as homeless during the study pe- riod to be included. All patients included were over the age of 18. A flow diagram of study inclusion/exclusion is presented in Fig. 1.

Demographic variables including age, sex, race, ethnicity and insur-

ance status were evaluated with descriptive statistics including means and standard deviations, medians and inter-quartile ranges, counts, per- centages and p-values, as appropriate (Table 1). Age and homelessness

were compared using means with two-sample t-test and medians with a non-parametric K-sample test on the equality of medians. Sex, race and ethnicity were compared using Pearson chi-squared statistical tests. Our primary outcome variable is ED utilization represented by the multivariate analysis of revisits after 30 days, 6 months, one and two years (Table 2). Mode of arrival, Emergency Severity Index [37], social work (SW) encounter and ED disposition were compared between the study and control group with counts and percentages, 95% confidence intervals, odds ratios and p-values using Pearson chi- squared tests (Table 3). Chief complaints were similarly analyzed after being aggregated into categories and subcategories (Table 4).

Odds ratios, with 95% confidence intervals and p-values, were uti- lized for a multivariate analysis comparing revisit rates of study group and controls. The multivariate analysis consisted of a logistic regression model using generalized estimating equations to account for multiple index visits from the same patient. The model controlled for age, sex, race, ethnicity, and ESI. The same logistic regression model was utilized to compare odds of repeat visits with and without social work encoun- ter documentation at the preceding visit (Table 2). Descriptive and bi- variate analysis was undertaken using STATA version 14.2, and SPSS 23 was utilized for the multivariate analysis.

Results

During the two-year study period, 986 patients with documented homelessness accounted for 7532 ED visits (Table 1). The control group, with no indication of homelessness in their EMR, consists of 3482 Medicaid patients representing 5477 ED visits (Fig. 1). The home- less group has a mean of 7.6 visits (SD 19.9) and the control group has a mean of 1.6 visits (SD 2.1). The number of visits for the homeless and control groups range up to 316 and 49, respectively. Healthcare insur- ance status for visits of those experiencing homelessness was 53.5% Medicaid, 17.7% Medicare, 19.9% private insurance, and 8.3% uninsured. Demographics (Table 1) show patients with documented homeless- ness were significantly older with a median age of 42.8 (IQR 28.9-52.6) compared to controls 31.1 (IQR 23.9-44.8). Those with homelessness were also significantly more likely to be male compared to controls (56.3% vs. 47.8%). A significantly greater proportion of those with home- lessness were white (48.8% vs. 44.6%) and there was no significant

total ED visits a

(n = 194,685)

Adult ED visits

(n = 145,662)

Excluded pediatric visits

(n = 49,023)

Visits with documented homelessness b

(n = 7532)

Visits without documented homelessness

(n = 138,130)

Excluded non-Medicaid visits

(n = 132,653)

Visits with Medicaid controls

(n = 5477)

Fig. 1. Inclusion and exclusion flow diagram. aThe two year study period was from January 1, 2013 through December 31, 2014. bVisits by patients with address fields that contained: “homeless,” emergency shelter, hospital, place of worship, or keyword indicating homelessness, diagnosis with ICD-9 code v50, or keywords “homeless” or “homelessness” in chief complaint, clinician notes, social work notes, or discharge summary.

Table 1

Demographics represented as cases and visits by housing status.

Demographics

Patients

Visits

Homeless

Control

Total

p-Value

Homeless

Control

Total

p-Value

(n = 986)

(n = 3482)

(n = 4468)

(n = 7532)

(n = 5477)

(n = 13,009)

Age, mean (SD)

41.8 (14.4)

34.9 (13.2)

36.4 (13.8)

b0.001

42.9 (12.4)

35.7 (13.4)

39.9 (13.3)

b0.001

Age, median (IQR)

42.8 (28.9-52.6)

31.1 (23.9-44.8)

33.0 (24.8-47.5)

b0.001

45.1 (32.2-51.6)

32.4 (24.3-46.1)

41.1 (27.5-50.3)

b0.001

Male, n (%)

555 (56.3)

1663 (47.8)

2218 (49.6)

b0.001

4693 (62.3)

2408 (44.0)

7101 (54.6)

b0.001

White, n (%)

478 (48.8)

1507 (43.4)

1985 (44.6)

0.002

2776 (37.1)

2309 (42.3)

5085 (39.3)

b0.001

Black, n (%)

438 (44.7)

1631 (47.0)

2069 (46.5)

0.221

4386 (58.6)

2671 (48.9)

7057 (54.5)

b0.001

Other race, n (%)

63 (6.4)

334 (9.6)

397 (8.9)

0.002

327 (4.4)

481 (8.8)

808 (6.2)

b0.001

Hispanic, n (%)

85 (8.7)

421 (12.1)

506 (11.4)

0.003

569 (7.6)

633 (11.6)

1202 (9.3)

b0.001

difference between the proportions of black patients (44.7% vs. 47.0%). However, when compared to controls, black patients made up a signif- icantly greater proportion of visits by those with homelessness (58.6% vs. 48.9%). A significantly smaller proportion of Hispanic patients were experiencing homelessness (8.7% vs. 12.1%).

Mode of arrival, ESI, social work (SW) encounter and ED disposition were compared between the study and control group (Table 2). In the setting of homelessness there was a significantly greater proportion of ED revisits within one month (65.1% vs. 18.5%), within 6 months (82.7% vs. 31.6%), within one year (85.8% vs. 35.2%), and during the two-year study period (86.8% vs. 36.4%). When controlling for age, sex, race, ethnicity, and ESI, those living with homelessness were 7.65 times more likely to return to the ED within 30 days of their previous visit, 9.97 times more likely to return within 6 months, 10.63 times more likely to return within one year, and 11 times more likely to return within 2 years. Having a documented social work encounter at a prior visit decreased the odds of a repeat visit after 30 days (OR 2.78 vs. 3.27). However, this difference was not statistically significant, and the 95% confidence intervals overlap for each revisit time period with and without a prior social work encounter.

For patients with a history of homelessness, the odds are signifi-

cantly higher for utilizing emergency medical ambulance services (OR 1.82, CI 95% 1.69-1.95) and public bus services (OR 2.25, CI 95% 1.85-2.72) to get to the ED. The odds of arriving by private car (OR 0.29, CI 95% 0.27-0.32) and police vehicle (OR 0.66, CI 95% 0.47-0.93)

are significantly lower in the setting of homelessness. The ESI score, ranging from ‘Immediate’ (1) to ‘Non-urgent’ (5), assigned at triage was utilized to assess Visit acuity for the study and control group. There was no significant difference in ‘Immediate’ (1) severity assign- ments between the two groups. Patients with homelessness have signif- icantly greater odds of presenting with an ‘Emergent’ (2) condition (OR 1.89, CI 95% 1.75-2.03) and ‘Non-Urgent’ (5) condition (OR 1.57, CI 95% 1.35-1.83). The odds are significantly lower for the homeless having conditions that are ‘Urgent’ (3) (OR 0.56, CI 95% 0.52-0.60) and ‘Less Ur- gent’ (4) (OR 0.83, CI 95% 0.76-0.91) (Table 3).

Patients with homelessness had higher odds of documented social work encounters (OR 1.72, CI 95% 1.57-1.89). For disposition, there were significantly lower odds for discharge (OR 0.59, CI 95% 0.54-0.64) and medical observation (OR 0.63, CI 95% 0.53-0.75) in the setting of homelessness. Those with homelessness were more likely to be sent for evaluation to the Comprehensive Psychiatric Emergency Program (CPEP) (OR 2.48, CI 95% 2.23-2.77), a psychiatric emergency

unit adjacent to and part of the medical ED, which provides psychiatric evaluations and facilitates admission to inpatient psychiatric units (Table 3).

Chief complaints were categorized by mental health, medical and trauma complaints or conditions (Table 4). The most common chief complaints for those with a record of homelessness were alcohol intox- ication (12.1%), abdominal pain (9.2%), psychiatric evaluation (8.8%), chest pain (8.7%), and suicide ideation or attempt (6.5%). In the control group the top five chief complaints were abdominal pain (13.9%), chest pain (8.7%), back pain (5.1%), psychiatric evaluation (4.4%), and head- ache (3.9%). A bivariate analysis of chief complaint categories revealed significantly increased odds for mental health issues (OR 2.18) including psychiatric evaluation (OR 2.09), suicide ideation or attempt (OR 2.29), depression (OR 2.88), homicidal (OR 4.70), hallucinations (OR 2.92), and paranoia (OR 3.83). There was a statistically significant difference by housing status for Substance use disorders (OR 3.93) notably for alco- hol intoxication or problem (OR 5.31), and withdrawal (OR 1.84). Addi- tionally, there were a significant proportion of individuals experiencing leg pain (OR 1.77) and toe pain (OR 4.45) compared to the control group.

Discussion

Summary of results

When controlling for age, sex, race, ethnicity, and ESI, those living with homelessness were 7.65 times more likely to return to the ED within 30 days of their previous visit, 9.97 times more likely to return within 6 months, 10.63 times more likely to return within one year, and 11 times more likely to return within 2 years compared to patients enrolled in Medicaid. Those with documented homelessness had signif- icantly higher ambulance and social service utilization, were assigned higher Emergency Severity Index scores, and were more likely to be admitted to the Comprehensive Psychiatric Emergency Program (CPEP). They had significantly increased odds for mental health and substance use disorders.

We chose a control group of all Medicaid-enrolled patients in the two-year time period rather than the general population to better con- trol for the effects of low socioeconomic status on ED utilization, and to more specifically demonstrate the effects of homelessness. Previous work describing ED utilization among homeless populations have been done without a control group [3-6, 34], or compared to the general

Table 2

Odds of emergency department revisits for patients with documented homelessness.

ED revisitsa All visits Visits proceeded by SW encounter Visits not proceeded by SW encounter

Odds ratio (95% CI)

p-Value

Odds ratio (95% CI)

p-Value

Odds ratio (95% CI)

p-Value

30 day

7.65 (5.89-9.94)

b0.001

2.78 (1.76-4.41)

b0.001

3.27 (2.48-4.33)

b0.001

6 month

9.97 (7.99-12.43)

b0.001

3.58 (2.34-5.47)

b0.001

3.53 (2.76-4.51)

b0.001

1 year

10.63 (8.62-13.11)

b0.001

3.28 (2.11-5.11)

b0.001

3.52 (2.78-4.45)

b0.001

2 year

11.00 (8.96-13.50)

b0.001

3.24 (2.11-4.98)

b0.001

3.52 (2.80-4.43)

b0.001

a Logistic regression models controlled for age, sex, race, ethnicity, and Emergency Severity Index .

Policy change“>Table 3

Bivariate analysis of service utilization indicators by housing status.

Homeless visits (n = 7532) Control visits (n = 5477) Bivariate analysis

n (%)

CI (95%)

n (%)

CI (95%)

OR (CI 95%)

p-Value

Mode of arrivala

Ambulance

4400 (58.4)

57.3-59.5

2407 (43.9)

42.6-45.3

1.82 (1.69-1.95)

b0.001

Walk-in

1482 (19.7)

18.8-20.6

1046 (19.1)

18.1-20.2

1.04 (0.95-1.14)

0.392

Car

785 (10.4)

9.7-11.1

1552 (28.3)

27.1-29.6

0.29 (0.27-0.32)

b0.001

Bus

427 (5.7)

5.2-6.2

143 (2.6)

2.2-3.1

2.25 (1.85-2.72)

b0.001

Other

148 (2.0)

1.7-2.3

115 (2.1)

1.7-2.5

0.94 (0.73-1.20)

0.596

Police

65 (0.9)

0.7-1.1

71 (1.3)

1.0-1.6

0.66 (0.47-0.93)

0.017

Taxi

83 (1.1)

0.9-1.4

46 (0.8)

0.6-1.1

1.32 (0.92-1.89)

0.135

Emergency Severity Index

Immediate (1)

11 (0.1)

0.1-0.3

11 (0.2)

0.1-0.4

0.73 (0.32-1.64)

0.453

Emergent (2)

3223 (42.8)

41.7-43.9

1555 (28.4)

27.2-29.6

1.89 (1.75-2.03)

b0.001

Urgent (3)

2493 (33.1)

32.0-34.2

2578 (47.1)

45.7-48.4

0.56 (0.52-0.60)

b0.001

Less urgent (4)

1273 (16.9)

16.1-17.8

1080 (19.7)

18.7-20.8

0.83 (0.76-0.91)

b0.001

Non-urgent (5)

532 (7.1)

6.5-7.7

253 (4.6)

4.1-5.2

1.57 (1.35-1.83)

b0.001

SW encounter

Documented

1699 (22.6)

21.6-23.5

792 (14.5)

13.5-15.4

1.72 (1.57-1.89)

b0.001

ED dispositiona

Discharge

5005 (66.4)

65.4-67.5

4146 (75.7)

74.5-76.8

0.59 (0.54-0.64)

b0.001

AMA

206 (2.7)

2.4-3.1

115 (2.1)

1.7-2.5

1.31 (1.04-1.65)

0.021

Died

7 (0.1)

0.0-0.2

7 (0.1)

0.1-0.3

0.73 (0.27-1.99)

0.550

Admitted

109 (1.4)

1.2-1.7

93 (1.7)

1.4-2.1

0.85 (0.64-1.12)

0.256

CPEPb

1497 (19.9)

19.0-20.8

502 (9.2)

8.4-10.0

2.48 (2.23-2.77)

b0.001

Observation

237 (3.1)

2.8-3.6

269 (4.9)

4.4-5.5

0.63 (0.53-0.75)

b0.001

Transfer

41 (0.5)

0.4-0.7

37 (0.7)

0.5-0.9

0.81 (0.52-1.25)

0.340

a Out of 13,009 visits, 293 are missing data for mode of arrival and 738 for disposition.

b CPEP is a Comprehensive Program for Emergency psychiatry that is adjacent to and part of the ED.

population [35]. A study of 6494 patients with homelessness in the Bos- ton Health Care for the Homeless Program had an annual average of four ED visits, however this was not compared to a control group of low- income individuals in the area. This makes it challenging to assess the effect of homelessness on healthcare utilization, as socioeconomic sta- tus is a major confounding factor.

4.2. A need for policy change

Given the high utilization and significant costs of emergency depart- ment revisits by individuals who are unsheltered [3, 15-17, 38], dis- charge planning should address the biopsychosocial issues of those with homelessness. There is a clear need for comprehensive evaluation

Table 4

Bivariate analysis of chief complaints by housing status.

Chief complaint

Homeless

Control

OR (CI 95%)

p-Value

n (%)

CI (95%)

n (%)

CI (95%)

Mental health

1514 (20.1)

19.2-21.0

566 (10.3)

9.5-11.2

2.18 (1.97-2.42)

b0.001

Suicide ideation and/or attempt

491 (6.5)

6.0-7.1

162 (3.0)

2.5-3.4

2.29 (1.91-2.74)

b0.001

Depression

137 (1.8)

1.5-2.1

35 (0.6)

0.4-0.9

2.88 (1.99-4.17)

b0.001

Anxiety

78 (1.0)

0.8-1.3

63 (1.2)

0.9-1.5

0.90 (0.64-1.25)

0.528

Homicidal

77 (1.0)

0.8-1.3

12 (0.2)

0.1-0.4

4.70 (2.58-8.57)

b0.001

Hallucinations

60 (0.8)

0.6-1.0

15 (0.3)

0.2-0.5

2.92 (1.67-5.12)

b0.001

Delusional

10 (0.1)

0.1-0.2

4 (0.1)

0.0-0.2

1.82 (0.60-5.48)

0.306

Substance abuse disorder

1187 (15.8)

14.9-16.6

249 (4.5)

4.0-5.1

3.93 (3.41-4.52)

b0.001

alcohol intoxication/problem

1008 (13.4)

12.6-14.2

155 (2.8)

2.4-3.3

5.31 (4.46-6.31)

b0.001

Drug overdose

84 (1.1)

0.9-1.4

58 (1.1)

0.8-1.4

1.05 (0.75-1.47)

0.765

Drug/alcohol withdrawal

48 (0.6)

0.5-0.8

19 (0.3)

0.2-0.5

1.84 (1.09-3.12)

0.023

Abdominal pain

698 (9.3)

8.6-9.9

785 (14.3)

13.4-15.3

0.61 (0.55-0.68)

b0.001

Chest pain

655 (8.7)

8.1-9.4

477 (8.7)

8.0-9.5

1.00 (0.88-1.13)

0.964

Trauma

588 (7.8)

7.2-8.4

643 (11.7)

10.9-12.6

0.64 (0.57-0.72)

b0.001

Assault

141 (1.9)

1.6-2.2

119 (2.2)

1.8-2.6

0.86 (0.67-1.10)

0.223

sexual assault

19 (0.3)

0.2-0.4

13 (0.2)

0.1-0.4

1.06 (0.53-2.12)

0.868

Fall

127 (1.7)

1.4-2.0

118 (2.2)

1.8-2.6

0.78 (0.61-1.00)

0.051

Motor vehicle crash

19 (0.3)

0.2-0.4

16 (0.3)

0.2-0.5

0.86 (0.45-1.66)

0.662

Burn

13 (0.2)

0.1-0.3

14 (0.3)

0.1-0.4

0.67 (0.32-1.41)

0.303

Stab wound

4 (0.1)

0.0-0.1

14 (0.3)

0.1-0.4

0.21 (0.07-0.60)

0.002

Back pain

410 (5.4)

4.9-6.0

280 (5.1)

4.5-5.7

1.07 (0.91-1.25)

0.414

Headache

284 (3.8)

3.4-4.2

212 (3.9)

3.4-4.4

0.97 (0.81-1.17)

0.759

Dyspnea

232 (3.1)

2.7-3.5

166 (3.0)

2.6-3.5

1.02 (0.83-1.24)

0.881

Leg pain

204 (2.7)

2.4-3.1

85 (1.6)

1.2-1.9

1.77 (1.37-2.28)

b0.001

Emesis

136 (1.8)

1.5-2.1

181 (3.3)

2.8-3.8

0.54 (0.43-0.67)

b0.001

Seizures

123 (1.6)

1.4-1.9

148 (2.7)

2.3-3.2

0.60 (0.47-0.76)

b0.001

Toe pain

115 (1.5)

1.3-1.8

19 (0.3)

0.2-0.5

4.45 (2.75-7.21)

b0.001

and evidence-based, cost-Effective interventions for those with the greatest healthcare expenditures [39].

Federal legislation through the Emergency medical treatment and Labor Act mandates the evaluation and treatment of all individuals com- ing to emergency departments regardless of ability to pay. However, there is no parallel emergency safe housing mandate [31]. Investing in targeted housing interventions for our most marginalized citizens on local, state and national levels is both ethically sound and a significant opportunity for improving outcomes and reducing Healthcare costs. In- terventions, such as Housing First, for individuals who are homeless have been shown to reduce utilization of emergency services as well as improve outcomes [9, 40-42].

Those experiencing homelessness were over 5 times more likely to present to the emergency department with alcohol intoxication, and this was our study group’s most common chief complaint. Alcohol abuse interventions, including ED linked rehabilitation programs and sober centers, may serve to be high-impact for reducing morbidity, mor- tality, and emergency care utilization.

Importantly, by evaluating the extent of emergency health care uti- lization of those with documented homelessness, we can make more in- formed local public health and institutional policy changes to improve the integration of medical, mental health, substance abuse, and housing services. This information can also serve as a benchmark for future in- terventions. Next steps would include prospective studies evaluating the impact of targeted interventions on health service utilization and costs for our most marginalized population.

Limitations

There are a number of limitations inherent to this study. Generaliz- ability of the population and comparison group is limited given the data was extracted from the electronic medical records of a single aca- demic medical center. However, given this study’s sample size and di- versity of patients at this medical center, which serves as the region’s largest tertiary care center, we felt that our sample was suited to address the purpose of this study. There are challenges in the identification of homelessness through a chart review – as homelessness can be chronic or episodic and may not be completely captured with the methods de- scribed. We did not evaluate for extended histories of homelessness for the study population and acknowledge that housing status would be more accurately described along a spectrum rather than as two cat- egories. We tried to address this issue by including patients that had documentation indicating homelessness at any given time during the study period.

It is important to acknowledge that this study does not establish cau- sality, and, as a retrospective study, it is strictly demonstrating associa- tions. Particularly with our analysis of chief complaints, it would be reasonable to postulate that some presentations more common among those with documented homelessness (e.g. mental health, drug and alcohol conditions) contribute to the risk of homelessness and vice-versa. That being said, these data are powered to demonstrate a significant association between homelessness and emergency care utilization.

Conclusions

Compared to all Medicaid patients presenting to an Urban academic medical center, patients with documented homelessness were over seven times more likely to return to the ED within 30 days and over eleven times more likely to return to the ED in two years. To reduce health care utilization and costs, it will be important to address the biopsychosocial issues of those with the greatest healthcare utilization and improve the integration of preventative primary care, mental health, substance abuse, social, and housing services for the homeless. Next steps include implementation science and prospective studies

evaluating the impact of targeted interventions on health service utili- zation and costs for one of our most marginalized populations.

Funding sources/disclosures

This research did not receive any specific grant from funding agen- cies in the public, commercial, or not-for-profit sectors. Authors have no conflicts of interest to declare.

Acknowledgments

The authors wish to acknowledge Dr. Josef Bartles contributions to study concept and IRB approval, Jennifer Corcoran for data collection, Dr. Adrienne Morgan for guidance and the University of Rochester’s Street Outreach program.

References

  1. The 2016 annual homeless assessment report (AHAR) to congress. Available at https://www.hudexchange.info/resources/documents/2016-AHAR-Part-1.pdf; 2016, Accessed date: 31 March 2017.
  2. Basu A, Kee R, Buchanan D, Sadowski LS. Comparative cost analysis of housing and Case management program for chronically ill homeless adults compared to usual care. Health Serv Res 2012;47:523-43.
  3. Bharel M, Lin WC, Zhang J, O’Connell E, Taube R, Clark RE. Health care utilization pat- terns of homeless individuals in Boston: preparing for Medicaid expansion under the Affordable Care Act. Am J Public Health 2013;103(Suppl. 2):S311-7.
  4. Fuehrlein BS, Cowell AJ, Pollio DE, Cupps LY, Balfour ME, North CS. Deriving costs of service use among an urban homeless population. J Subst Abus Treat 2014;46: 491-7.
  5. Lin WC, Bharel M, Zhang J, O’Connell E, Clark RE. Frequent emergency department visits and hospitalizations among homeless people with Medicaid: implications for Medicaid expansion. Am J Public Health 2015;105(Suppl 5):S716-22.
  6. Kushel MB, Perry S, Bangsberg D, Clark R, Moss AR. Emergency department use among the homeless and marginally housed: results from a community-based study. Am J Public Health 2002;92:778-84.
  7. Lebrun-Harris LA, Baggett TP, Jenkins DM, Sripipatana A, Sharma R, Hayashi AS, et al. Health status and health care experiences among Homeless patients in federally sup- ported health centers: findings from the 2009 patient survey. Health Serv Res 2013; 48:992-1017.
  8. O’Toole TP, Bourgault C, Johnson EE, Redihan SG, Borgia M, Aiello R, et al. New to care: demands on a health system when homeless veterans are enrolled in a medi- cal home model. Am J Public Health 2013;103(Suppl 2):S374-9.
  9. Mackelprang JL, Graves JM, Rivara FP. Homeless in America: injuries treated in US emergency departments, 2007-2011. Int J Inj Control Saf Promot 2014;21:289-97.
  10. Brown RT, Steinman MA. Characteristics of emergency department visits by older versus younger homeless adults in the United States. Am J Public Health 2013; 103:1046-51.
  11. Kay HF, Sathiyakumar V, Archer KR, Mathis SL, Apfeld JC, Lee YM, et al. The homeless orthopaedic trauma patient: follow-up, emergency room usage, and complications. J Orthop Trauma 2014;28:e128-32.
  12. Morrison DS. Homelessness as an independent risk factor for mortality: results from a retrospective cohort study. Int J Epidemiol 2009;38:877-83.
  13. Baggett TP, Hwang SW, O’Connell JJ, Porneala BC, Stringfellow EJ, Orav EJ, et al. Mor- tality among homeless adults in Boston: shifts in causes of death over a 15-year pe- riod. JAMA Intern Med 2013;173:189-95.
  14. O’Connell J. Premature mortality in homeless populations: a review of the literature. National Health Care for the Homeless Council, Inc.; 2005 Available at http://sbdww. org/wp-content/uploads/2011/04/PrematureMortalityFinal.pdf, Accessed date: 31 March 2017.
  15. Hwang SW, Chambers C, Chiu S, Katic M, Kiss A, Redelmeier DA, et al. A comprehen- sive assessment of health care utilization among homeless adults under a system of universal health insurance. Am J Public Health 2013;103(Suppl. 2):S294-301.
  16. Moore G, Gerdtz M, Manias E, Hepworth G, Dent A. Socio-demographic and clinical characteristics of re-presentation to an Australian inner-city emergency depart- ment: implications for service delivery. BMC Public Health 2007;7:320.
  17. Doran KM, Ragins KT, Iacomacci AL, Cunningham A, Jubanyik KJ, Jeng GY. The revolv- ing hospital door: Hospital readmissions among patients who are homeless. Med Care 2013;51:767-73.
  18. Brown RT, Kiely DK, Bharel M, Grande LJ, Mitchell SL. Use of acute care services among older homeless adults. JAMA Intern Med 2013;173:1831-4.
  19. Thakarar K, Morgan JR, Gaeta JM, Hohl C, Drainoni ML. Predictors of frequent emer- gency room visits among a homeless population. PLoS One 2015;10(4):e0124552.
  20. Chang G, Weiss AP, Orav E, Rauch SL. Predictors of frequent emergency department use among patients with psychiatric illness. Gen Hosp Psychiatry 2014;36:716-20.
  21. Vandyk AD, Harrison MB, Van Den Kerkhof EG, Graham ID, Ross-White A. Frequent emergency department use by individuals seeking mental healthcare: a systematic search and review. Arch Psychiatr Nurs 2013;27:171-8.
  22. Soril LJJ, Leggett LE, Lorenzetti DL, Noseworthy TW, Clement FM. Characteristics of frequent users of the emergency department in the general adult population: a

    systematic review of international healthcare systems. Health Policy Amst Neth 2016;120:452-61.

    Lam CN, Arora S, Menchine M. Increased 30-day emergency department revisits among homeless patients with mental health conditions. West J Emerg Med 2016; 17:607-12.

  23. Weiser SD, Hatcher A, Frongillo EA, Guzman D, Riley ED, Bangsberg DR, et al. Food insecurity is associated with greater acute care utilization among HIV-infected homeless and marginally housed individuals in San Francisco. J Gen Intern Med 2013;28:91-8.
  24. Baggett TP, Singer DE, Rao SR, O’Connell JJ, Bharel M, Rigotti NA. Food insufficiency and health services utilization in a national sample of homeless adults. J Gen Intern Med 2011;26:627-34.
  25. Lutwak N, Dill C. Homeless and older veterans may be at risk for malnutrition and food insecurity. Popul Health Manag 2017;20(5):419.
  26. Fitzpatrick-Lewis D, Ganann R, Krishnaratne S, Ciliska D, Kouyoumdjian F, Hwang SW. Effectiveness of interventions to improve the health and housing status of homeless people: a rapid systematic review. BMC Public Health 2011;11:638.
  27. World Health Organization. How can health care systems effectively deal with the major Health care needs of homeless people? Available at http://www.euro.who. int/en/data-and-evidence/evidence-informed-policy-making/publications/pre2009/ how-can-health-care-systems-effectively-deal-with-the-major-health-care-needs- of-homeless-people; 2017, Accessed date: 12 May 2017.
  28. Sadowski LS, Kee RA, Van der Weele TJ, Buchanan D. Effect of a housing and case management program on emergency department visits and hospitalizations among chronically ill homeless adults: a randomized trial. JAMA 2009;301:1771-8.
  29. Stergiopoulos V, Gozdzik A, Misir V, Skosireva A, Connelly J, Sarang A, et al. Effective- ness of housing first with intensive case management in an ethnically diverse sam- ple of homeless adults with mental illness: a randomized controlled trial. PLoS One 2015;10(7):e0130281.
  30. Herbst JL. Permanent patients: hospital discharge planning meets housing insecu- rity. Hast Cent Rep 2017;47:6-7.
  31. Fleisch SB, Nash R. Medical care of the homeless: an American and international issue. Prim Care 2017;44:57-65.
  32. Coleman J. Increasing overall well-being is salient in treating homelessness. Soc Work Public Health 2017;32:154-65.
  33. Kushel MB, Vittinghoff E, Haas JS. Factors associated with the health care utilization of homeless persons. JAMA 2001;285:200-6.
  34. Coe AB, Moczygemba LR, Harpe SE, Gatewood SBS. Homeless patients’ use of urban emergency departments in the United States. J Ambul Care Manag 2015;38:48-58.
  35. Zech J, Husk G, Moore T, Kuperman GJ, Shapiro JS. Identifying homelessness using health information exchange data. J Am Med Inform Assoc 2015;22:682-7.
  36. US Department of Health and Human Services, Agency for Healthcare Research and Quality. Emergency Severity Index : a triage tool for emergency department care. Available at https://www.ahrq.gov/sites/default/files/wysiwyg/professionals/ systems/hospital/esi/esihandbk.pdf, Accessed date: 18 August 2017.
  37. Ku BS, Fields JM, Santana A, Wasserman D, Borman L, Scott KC. The urban homeless: super-users of the emergency department. Popul Health Manag 2014;17:366-71.
  38. Casey R, Clark C, Smits P, Peters R. Application of implementation science for home- less interventions. Am J Public Health 2013;103:S183-4.
  39. Kozloff N, Adair CE, Palma Lazgare LI, Poremski D, Cheung AH, Sandu R, et al. ‘Hous- ing first’ for homeless youth with mental illness. Pediatrics 2016;138(4).
  40. Aubry T, Tsemberis S, Adair CE, Veldhuizen S, Streiner D, Latimer E, et al. One-year outcomes of a randomized controlled trial of housing first with ACT in five Canadian cities. Psychiatr Serv Wash DC 2015;66:463-9.
  41. Gilmer TP, Stefancic A, Henwood BF, Ettner SL. Fidelity to the housing first model and variation in health service use within permanent supportive housing. Psychiatr Serv Wash DC 2015;66:1283-9.

Leave a Reply

Your email address will not be published. Required fields are marked *