
Prognostic value of perihematomal edema area at the initial ED presentation in patients with intracranial hematoma

 Article Info
To view the full text, please login as a subscribed user or purchase a subscription. Click here to view the full text on ScienceDirect.
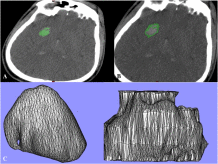
Fig. 1
The measurements of the intracranial hematoma and perihematomal edema volume.
A, B. Cranial axial CT slices show intracranial hematoma and perihematomal edema, C. 3-Dimensional construction of the hematoma, D. 3- Dimensional construction of the sphere containing the edema and the hematoma.
Fig. 2
The measurements of the intracranial hematoma and perihematomal edema area.
A. The area measuring tool of CT on the picture archiving and communication system of the hospital, B. Cranial axial CT slices show intracranial hematoma and perihematomal edema, C. A hematoma area outlined and calculated via area- measuring tool, D. A perihematomal edema and hematoma area outlined and calculated via area- measuring tool.
Fig. 3
Flow chart of the study design.
ICD: International Classification of Diseases; ICH: Intracranial hemorrhage; CTB: Computed tomography of brain; PHEAA: Perihematomal edema absolute area.
Fig. 4
Comparison of ROC curve of perihematomal edema absolute area and volume.
ROC: Receiver operating characteristic.
Fig. 5
Comparison of Kaplan–Meier survival curve of PHEAA cutoff for 30- day mortality.
PHEAA: perihematomal edema absolute area.
Abstract
Objective
Intracerebral hemorrhage (ICH) is a potentially life-threatening condition. Interventions and treatments should be managed on time to reduce mortality. It has been put forth that perihematomal edema absolute volume (PHEAV) is related to mortality, however the effect of perihematomal edema absolute area (PHEAA) on mortality is unknown. The objective of this study was to evaluate the effect of PHEAA on 30-day mortality in patients with ICH.
Methods
Patients were screened with ICD-9, retrospectively. 106 patients were included in the study. Clinical data were obtained from the patient files. Computed tomography (CT) was acquired from the hospital imaging database. PHEAV and PHEAA were measured via CT by two clinicians blinded to the study protocol. The predictors of 30- day mortality were examined.
Results
Forty-three (40.6%) patients died within 30 days. Older age, lack of trauma, low Glasgow coma scale and high blood glucose were associated with high mortality (P ≤ .001). PHEAV and PHEAA values were higher in nonsurvivors (P < .001). PHEAA was detected as an independent predictor of 30-day mortality. The cutoff value of PHEAA for mortality was 33.41 cm2 (sensitivity: 84.4%, specificity: 59.0%). There was no difference between receiver operating characteristic curves of PHEAA and PHEAV (P = .55).
Conclusion
In contrast to PHEAV, PHEAA is a simple value which can be measured without the requirement of any additional techniques or extra costs which can be quickly applied and which is an independent indicator of 30-day mortality. PHEAA can accelerate physician interventions for patients with ICH within several hours of ED admission.
To access this article, please choose from the options below
Purchase access to this article
Claim Access
If you are a current subscriber with Society Membership or an Account Number, claim your access now.
Subscribe to this title
Purchase a subscription to gain access to this and all other articles in this journal.
Institutional Access
Visit ScienceDirect to see if you have access via your institution.
There is no any source of support in the form of equipment, drugs, or grants related to our manuscript.
This manuscript hasn't been presented at any organization.
